Hello everyone, I need your help, because I can’t get any further here. I record the running time of my individual devices and try to display them in a bar gauge, but this doesn’t work properly. The values are in seconds and for Unit I have set: duration hh:mm:ss. Do you have an idea how I can implement that, because that’s not true at all. In the end, the display should look something like this: 2:30:24

Isn’t this the same issue that was resolved here?
Oh sorry, maybe I should have explained that better because it’s not exactly the same thing. The reason is that I blew up my entire system and now I have to rebuild everything. Now I have 10 devices from which I want to log the runtime. The name should be in the bar gauge on the left and then there should be a bar behind each device that shows me the time that the device was switched on. This value should then be on the right next to the bar. But I saw that the code looks completely different in another post. Unfortunately, I didn’t save it back then, so I’m now terribly puzzling over how it’s right. Maybe you could also post the correct code for me, then I can get on here. That would be super nice of you
Check documentation first and see if it answers your question
Thanks for pointing out the documentation. But I have already converted all this in Node Red and it is all about a correct representation of the board. I also have to admit that I don’t really get it all in the documentation,
Is it okay that I put all 10 devices in one query, or would it be better to create a single query for each device? As I said, it should be presented like this in the end:
Floor lamp on for 30 minutes 26 seconds
Imac on for 7 hours 45 minutes 20 seconds etc.
And it’s just not at all clear to me what the correct code in the query should look like in order to achieve my desired display, because unfortunately I didn’t save it away at the time.
Hi @damrak2022
Yes, put all 10 devices in one query. From the screenshot above, you seem to have it correct. What exactly is the problem? If it’s the issue about the values not being displayed as hh:mm:ss,

map() function. Did you change the units as shown below?
The ad is simply incorrect. I set the duration. And I just don’t know what to do with Grafana to get the correct value displayed behind the bar. I set the MIn value to 0 and left the Max value blank

The 269 on the TV should actually be displayed as hours and then minutes and seconds. The 269 would be 4 hours 29 minutes
Hi @damrak2022
Just to ask the obvious, your data values are stored in InfluxDB in HOURS and you put the map() function in to get the SECONDS, correct?


What time type is your data written as in influxdb: ns, s,m,h?
The values that are written to the runtime data point are minutes.
If your values in InfluxDB are in minutes, then in order for your graph and units to appear as HH:MM:SS, you need to convert minutes to seconds in the map() function (i.e. multiply by 60, not 3600). In other words, change the map to:
|> map(fn: (r) => ({r with _value: r._value * 60.0}))
Imagine if you had 500 devices. Always think "would whatever I am attempting to do scale for 10,50,250,1000 devices?"This principle holds true for many things in the technical world including queries
So would you write 500 queries if you had 500 devices. The intuitive answer would be “heck no”
May I ask 2 or 3 more things here.
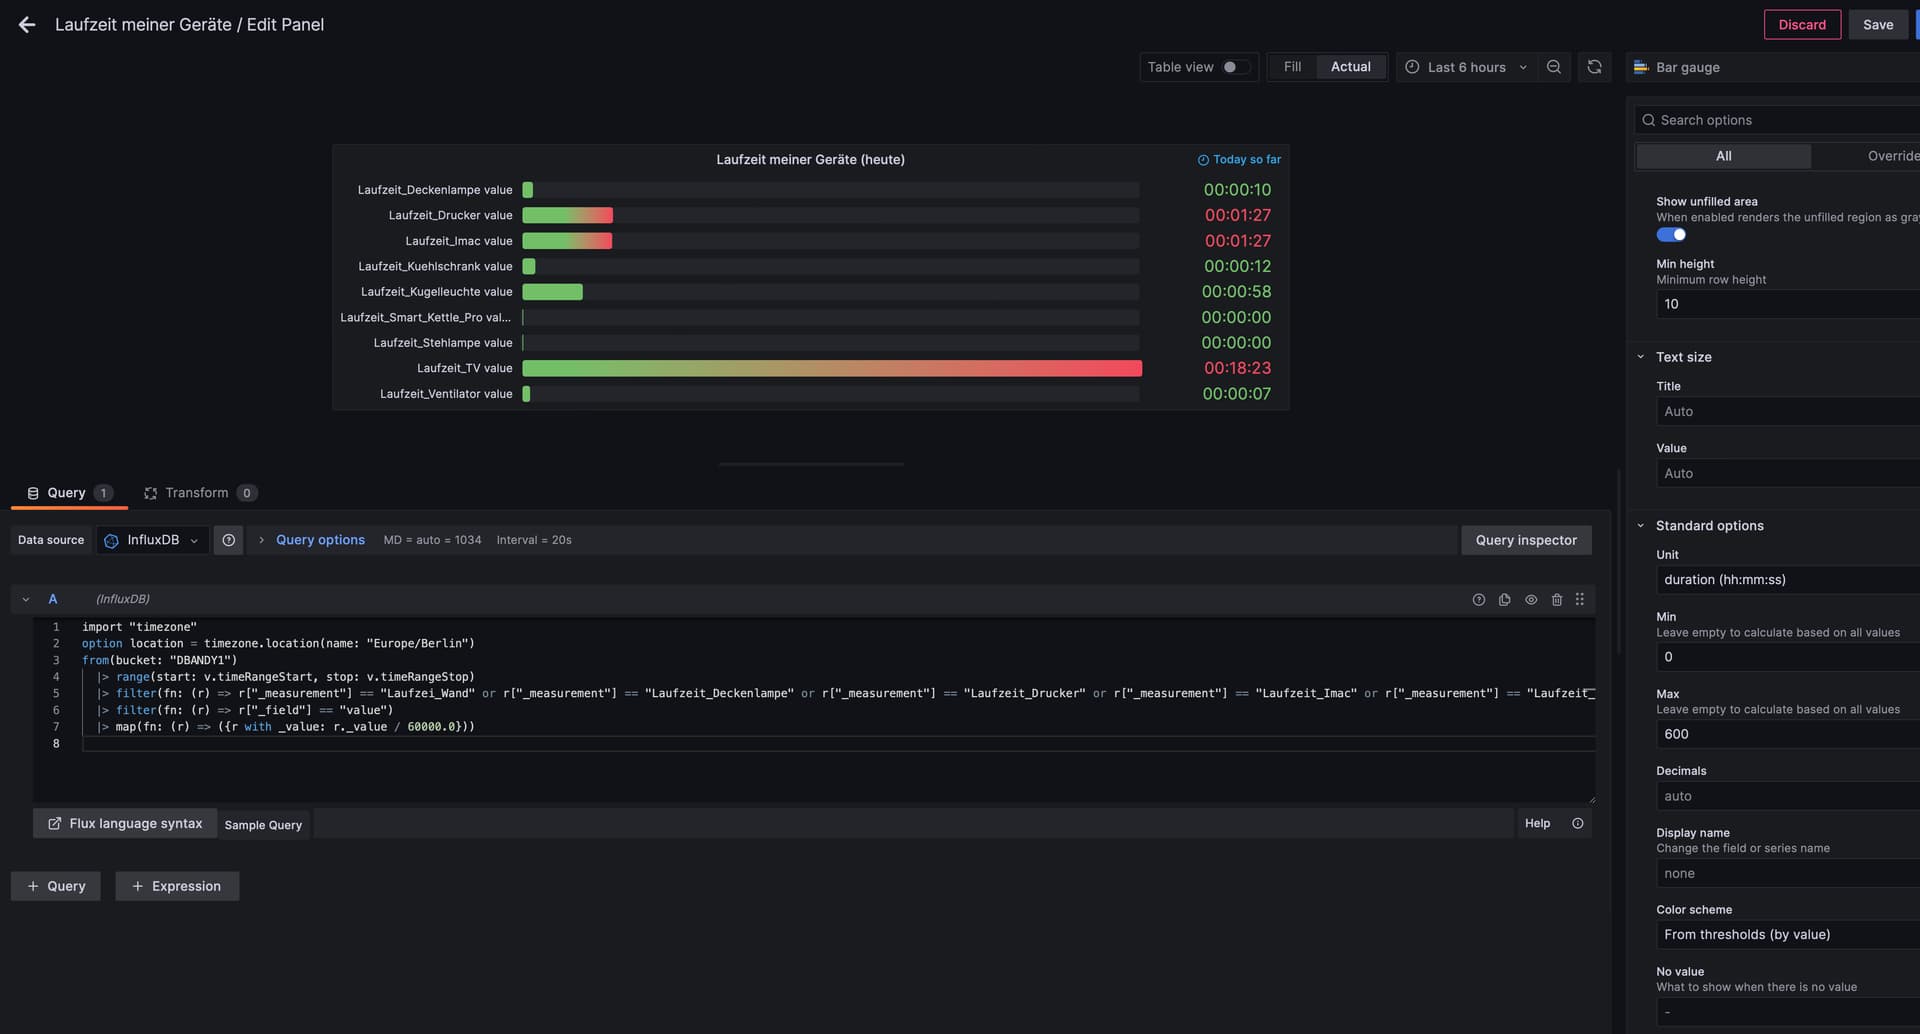
- On the board with the runtimes of the devices, I adjusted it as you explained it to me. Nevertheless, I get such a strange ad out of here.
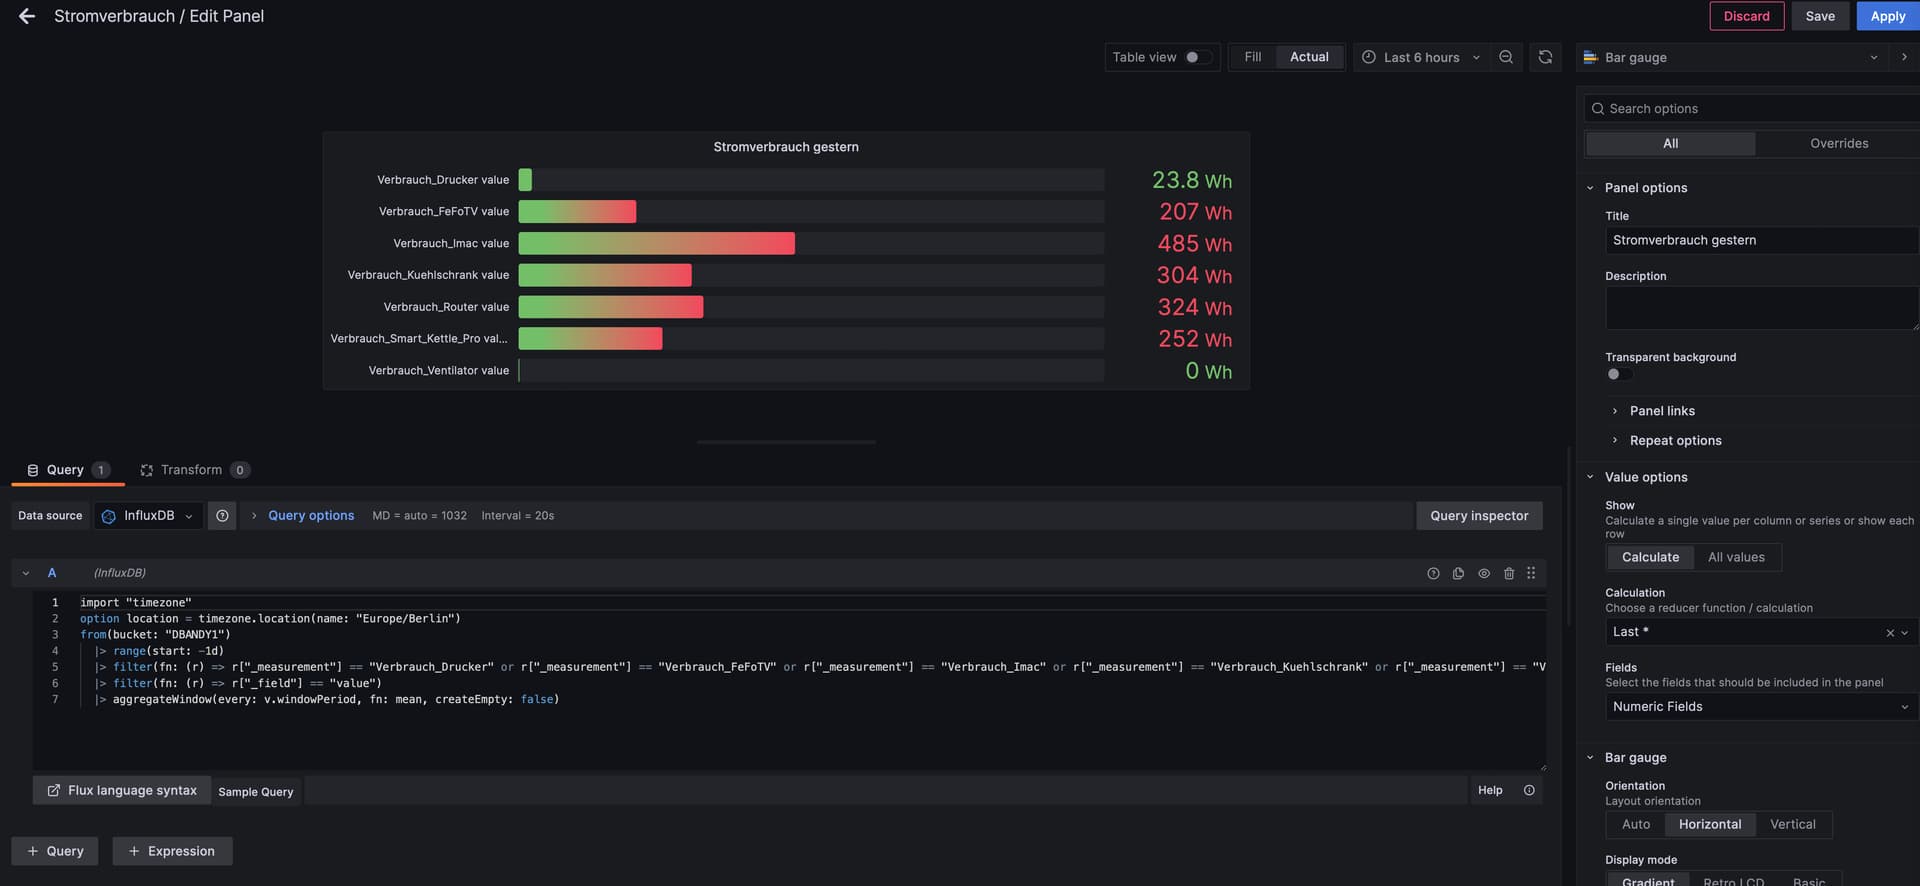
- I have 2 boards here, which show me the power consumption. The time range is -1d on one board - -7d on the other. Nevertheless, both boards show me the same values. Where is my mistake here?


No, the problem is that I blew up my entire system and had to set everything up from scratch. The system has been running again for about 3 days without any problems. Nevertheless, the display should be correct and also the time in hours - minutes - seconds, right?
Hence the dashboard being identical.
Nothing for -7. You blew the system -3~ days ago. Wait +4 days more to start seeing a differnce
So, I’ve changed that now so that all the calculations are done in Grafana itself. To test, I let my fan run for 7 minutes. The value 465007 ms is then written to the logged data point. In Grafana I divide that by 60000 see screenshot I entered “now/d” in the query options. For unit I entered the duration hh:mm:ss.
Still, I get such an abstruse display.

I really don’t want to get on your nerves, but it can’t be that I can’t get a reasonable ad here.
The other values are not correct either.
I really hope that you can help me here, because I would really like to finish this topic successfully.
If your values in InfluxDB are in ms, then change your map function to:
|> map(fn: (r) => ({r with _value: r._value / 1000.0}))
so that it returns values in seconds. As I concluded here, the only way for the duration (hh:mm:ss) to work is for the Influx query to return the value in seconds.
Also, is the aggregateWindow statement needed here? Maybe try it without it. As I understand it, you are simply storing the number of seconds each device is on and you want it to display in Grafana (as hh:mm:ss).
Also, I often see home power consumption queries where people store the kWh used, or the on/off status of something (lamp, television, etc), and then they use an elapsed() function or stateDuration() or something else to calculate the time the device is on. In your query, there does not appear to be any reference to power, so I presume you obtain these running times from some other query or datasource.
I don’t know if I understood that correctly. At the moment I calculate the running time of my devices, TV, floor lamp, router etc. only by subtracting the switch-off time from the switch-on time. I then have this value written to the runtime data point, where it is then available as milliseconds. That’s why I divide this value in Grafana by 60000
But if I now divide this value by 1000.0, as you recommended, that can’t be right - see screenshot.

I also omitted the Aggregate window function and divided it once by 60000 and once by 1000 - see screenshots

Here, too, I’m not sure if that’s true, because the values per day should be added up, since I switch the TV on and off 3 times a day, for example, and I want to have the total time that the TV set was switched on. I assume that I need the aggregate window function for this, right?
I never thought that this would be so difficult to implement, but hope to get it done with your help. In any case, thank you for your patience.