-
What Grafana version and what operating system are you using?
Grafana 10.0.2 (running in k3s, browsing through recent Chrome on Arch Linux, as well as an very outdated Chrome on a very outdated Nexus10 tablet - but I’m pretty sure it’s not a client issue) -
What are you trying to achieve?
This might sound like a weird one, since it’s basically one of the main use cases for the Stat panel, as far as I can understand - but it doesn’t behave like expected for me:
I want to show the most recent value of some metric queried from a Prometheus data source, like the current temperature (query: avg(homeassistant_sensor_temperature_celsius{entity="sensor...."}) or if my internet connection is up (query: min(probe_success{target="google-tcp"})), while also having the sparkline to see the current trend and recent history.
This is displayed on a dashboard refreshing every 5s and a 24h range, from now.
- How are you trying to achieve it?
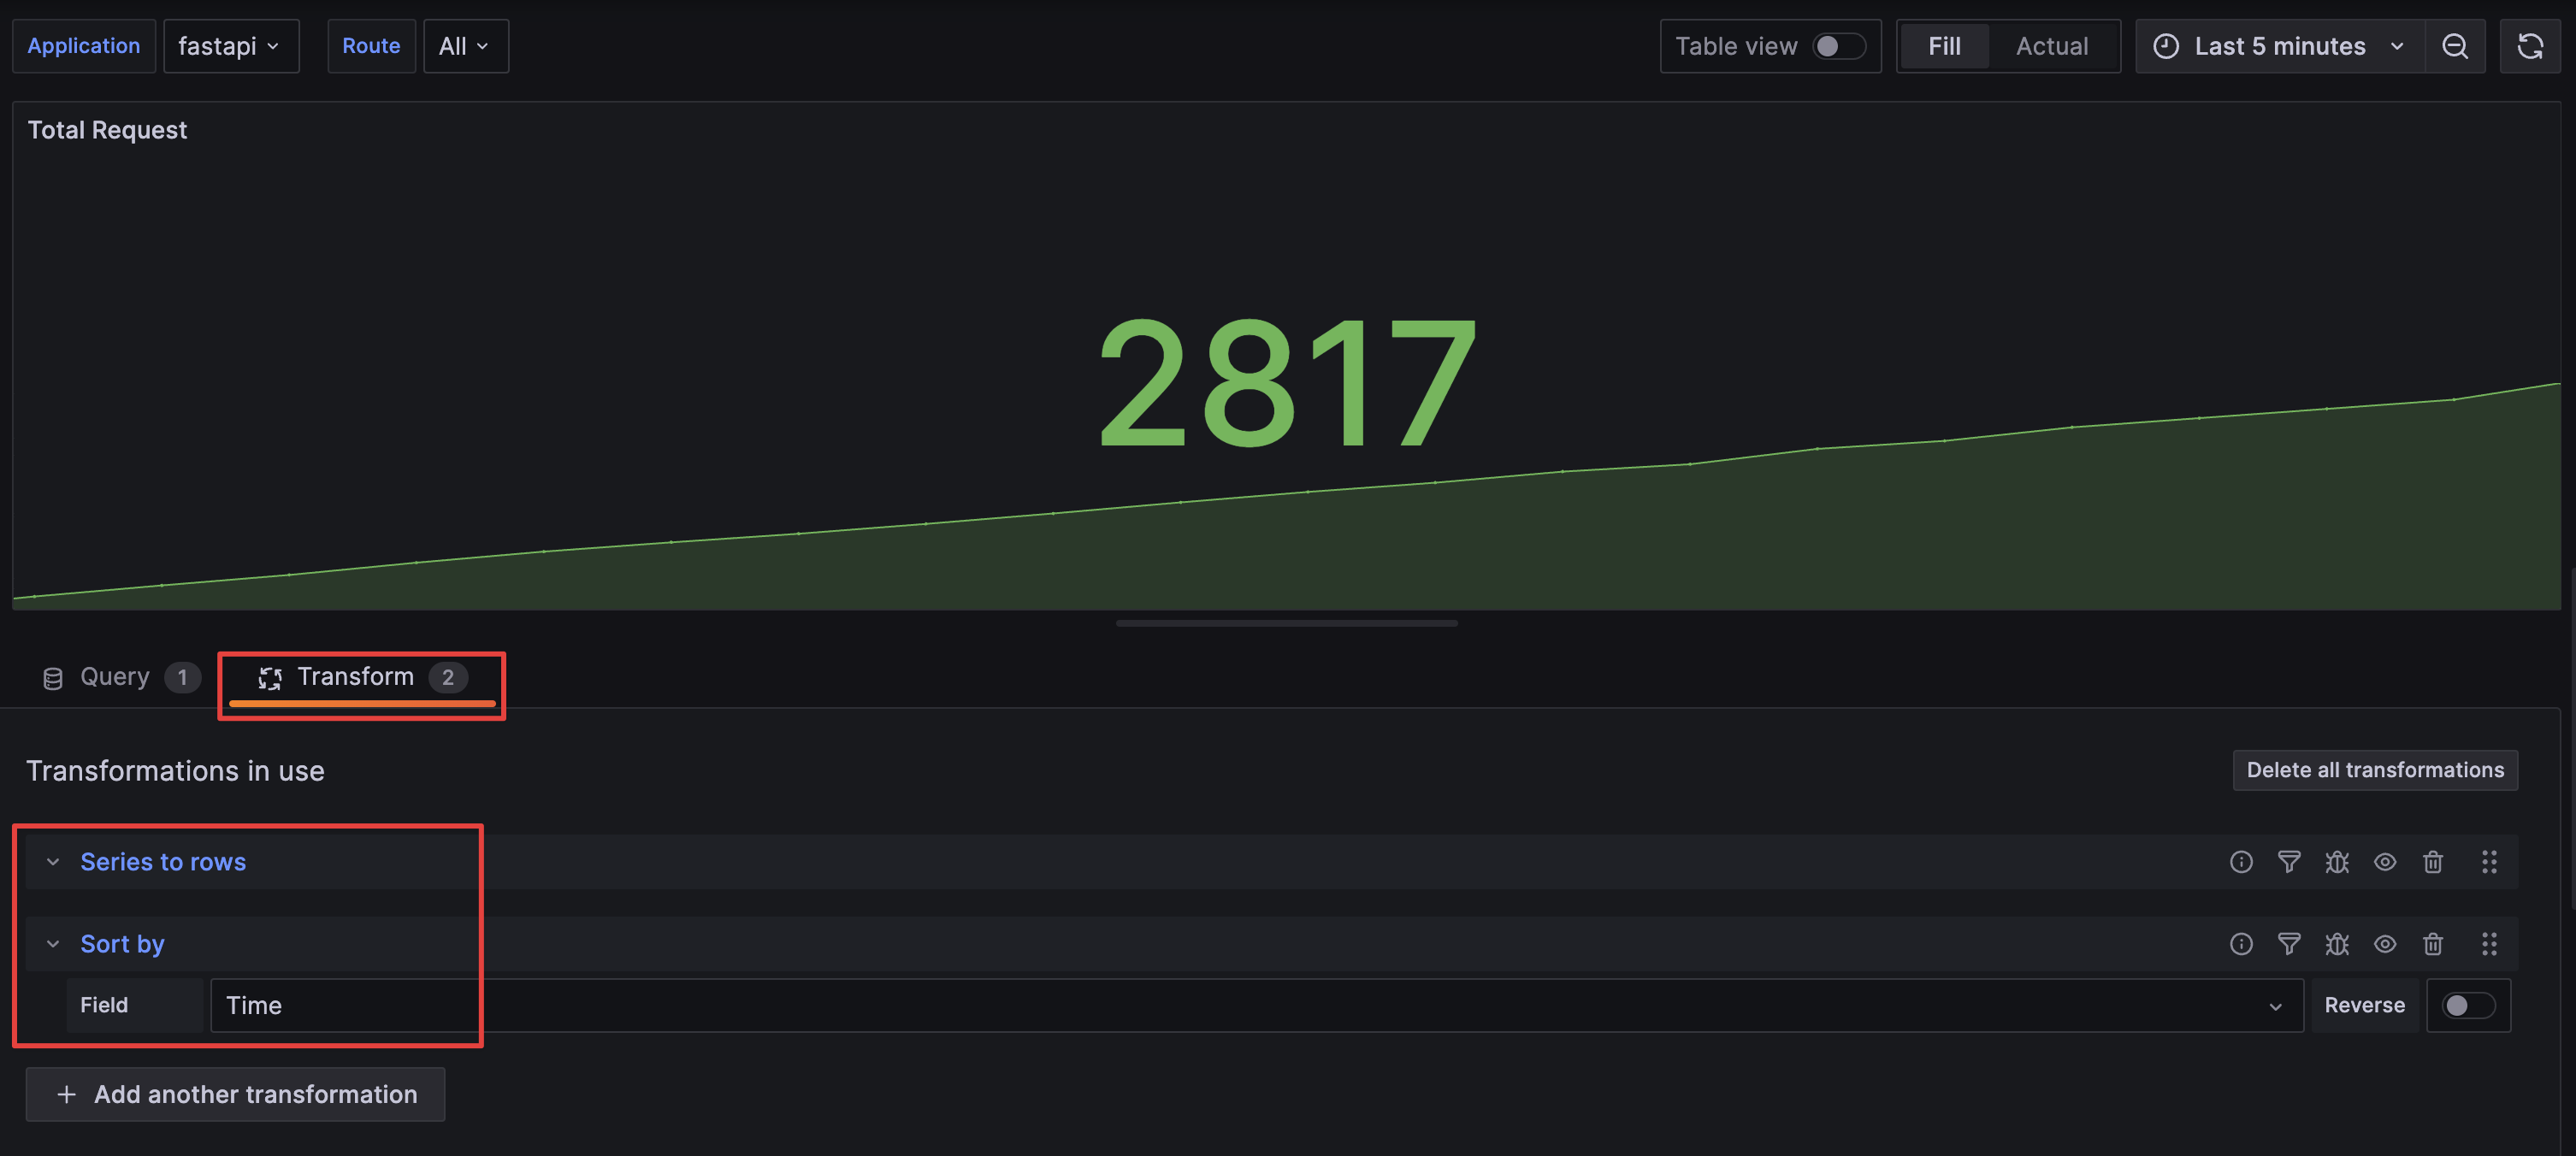
I created a Stat panel using default options (Prometheus range query, graphing the sparkline, no adjustment to data points, using either Last or Last* as calculation method), which seemed to work fine at first.
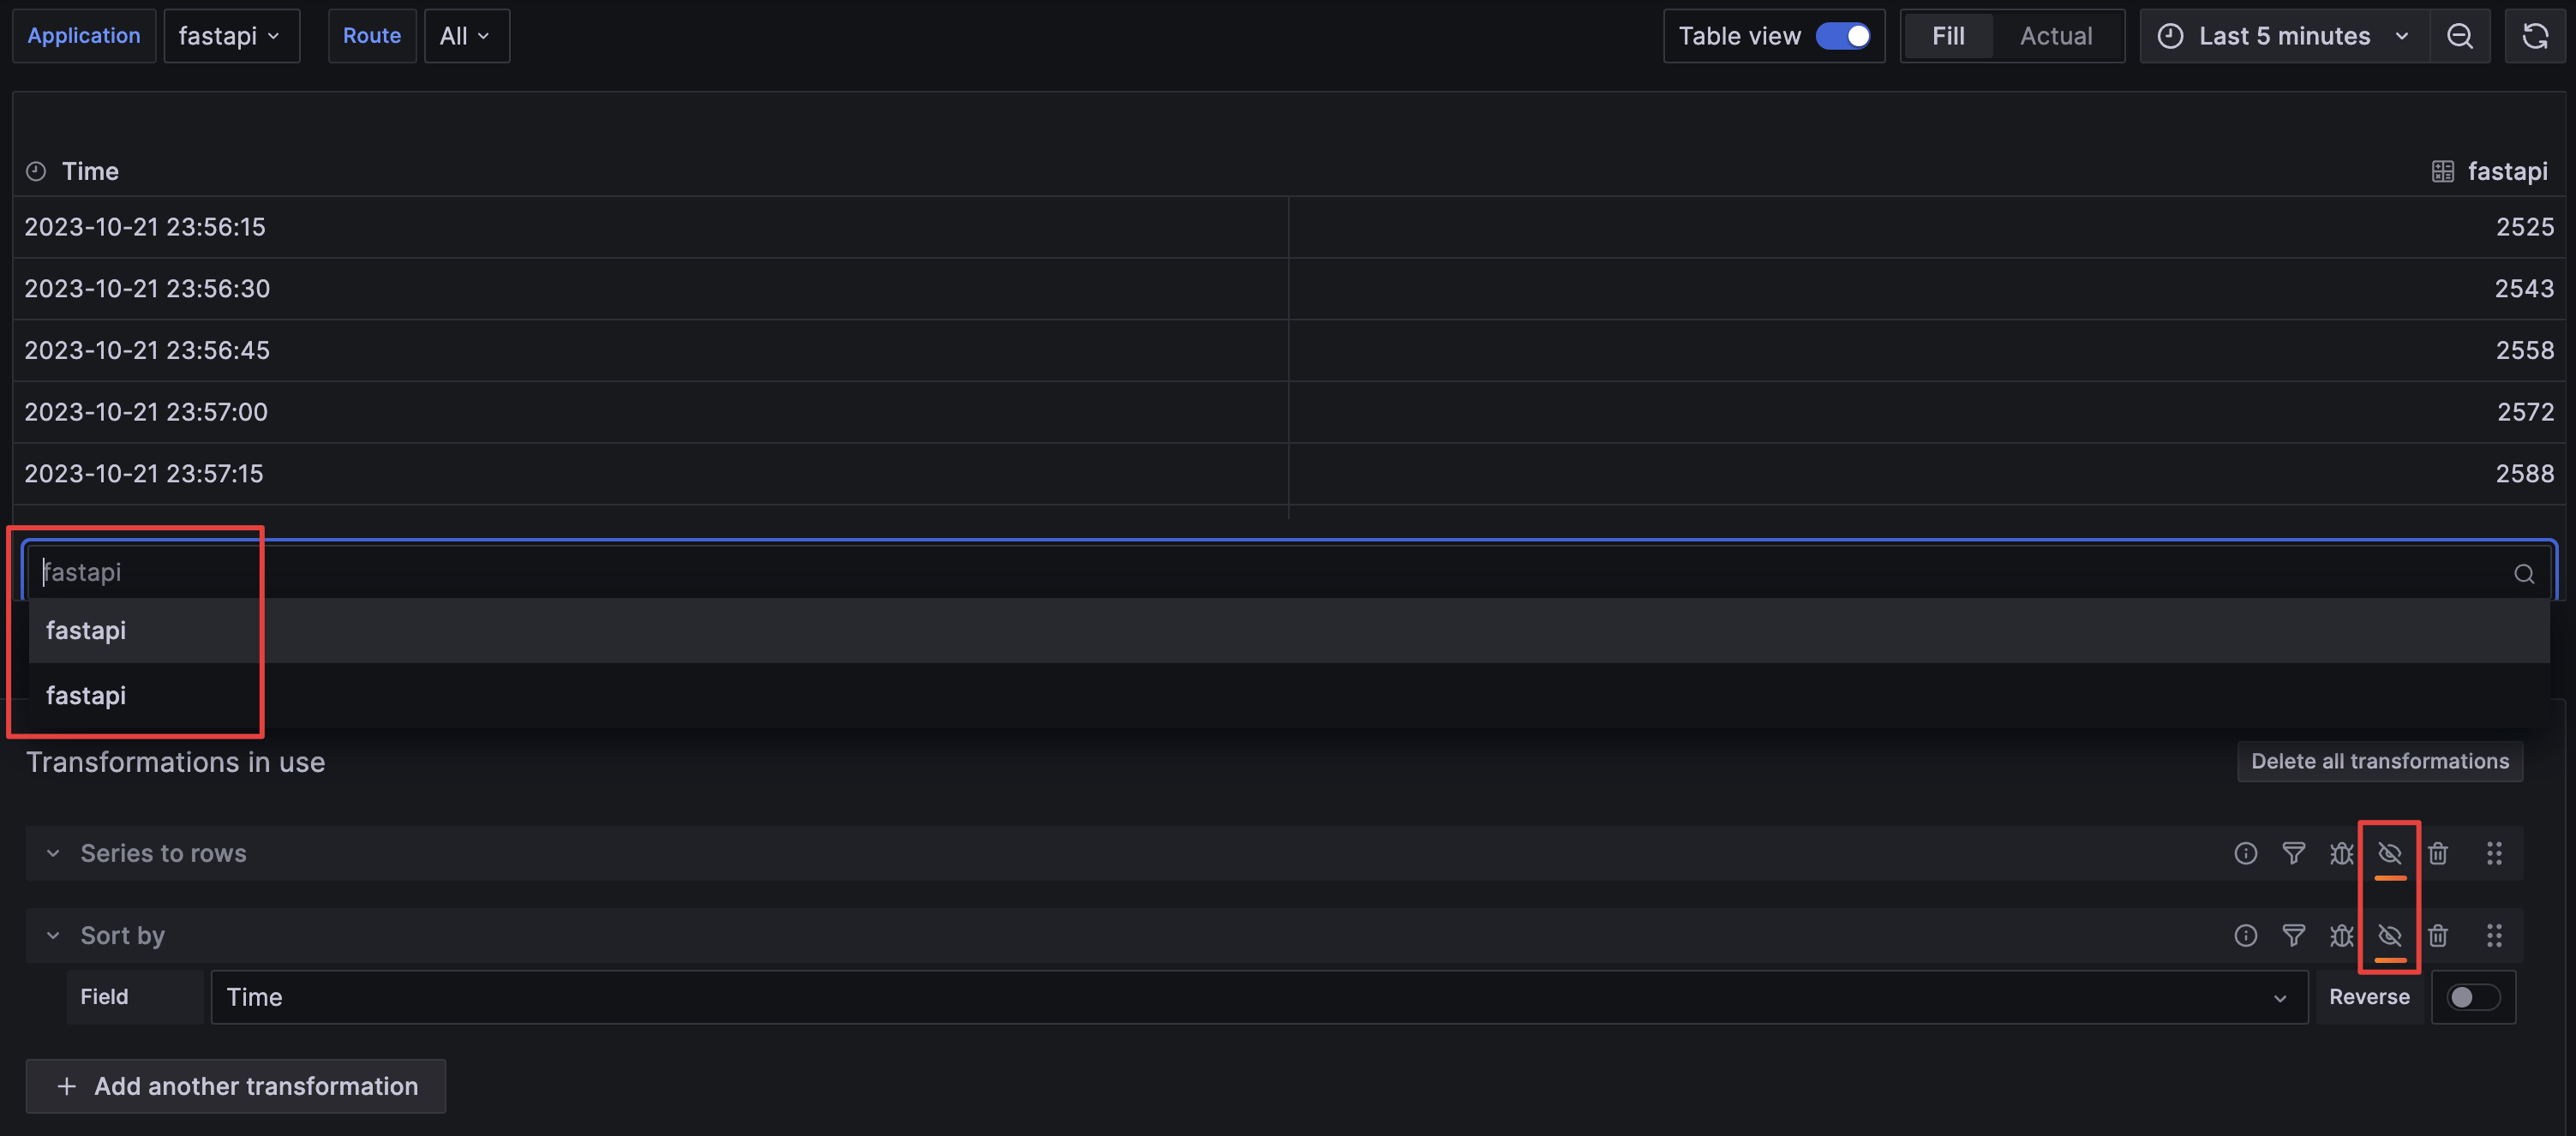
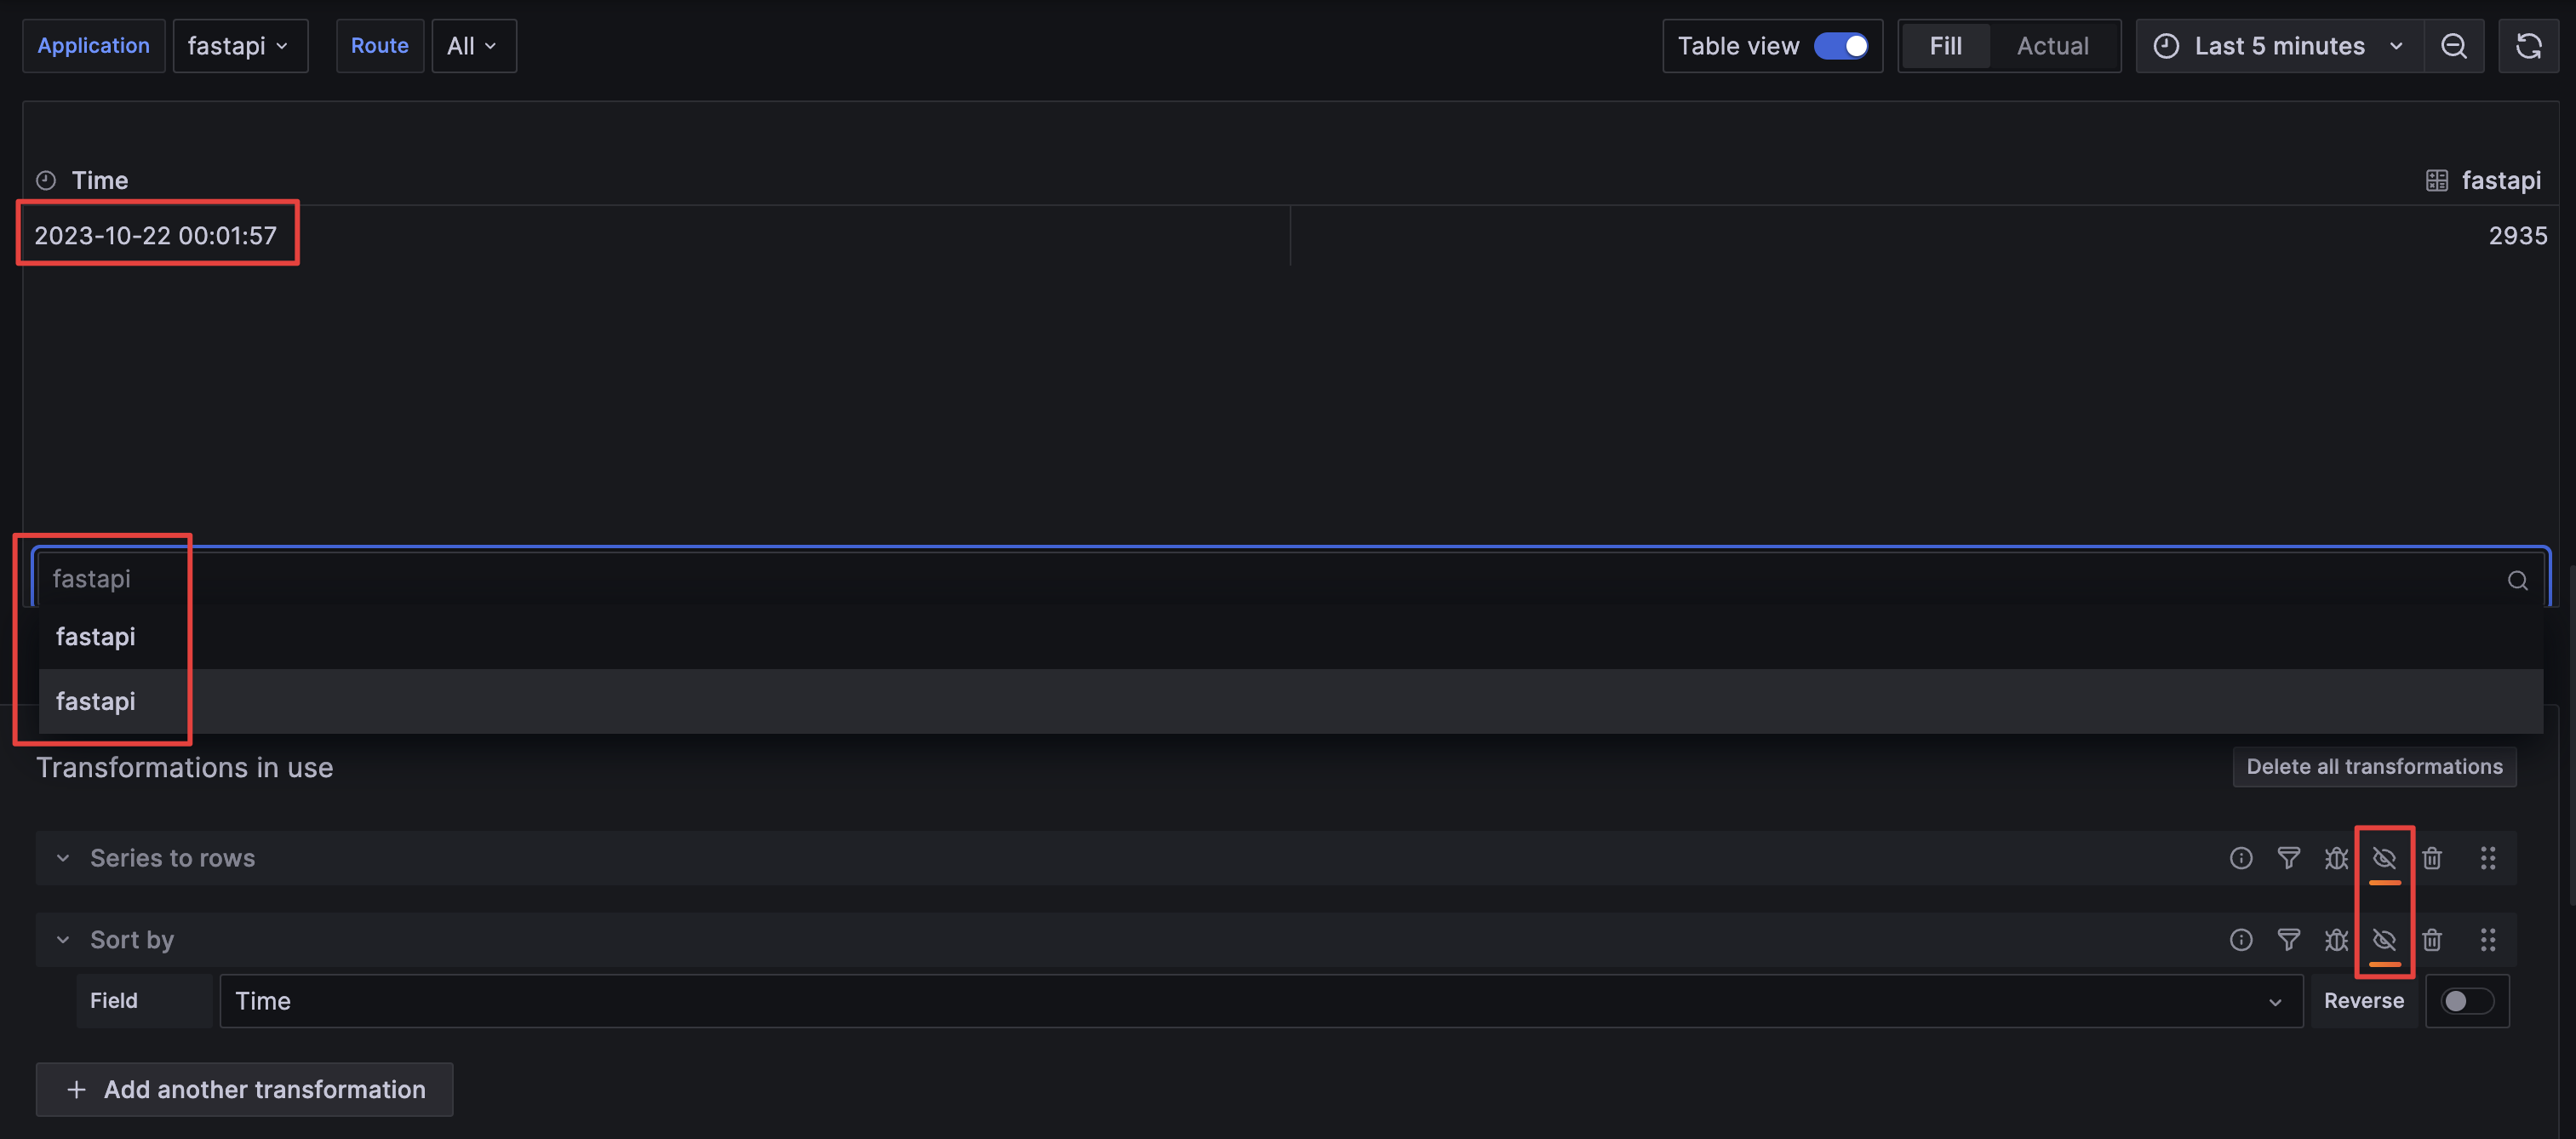
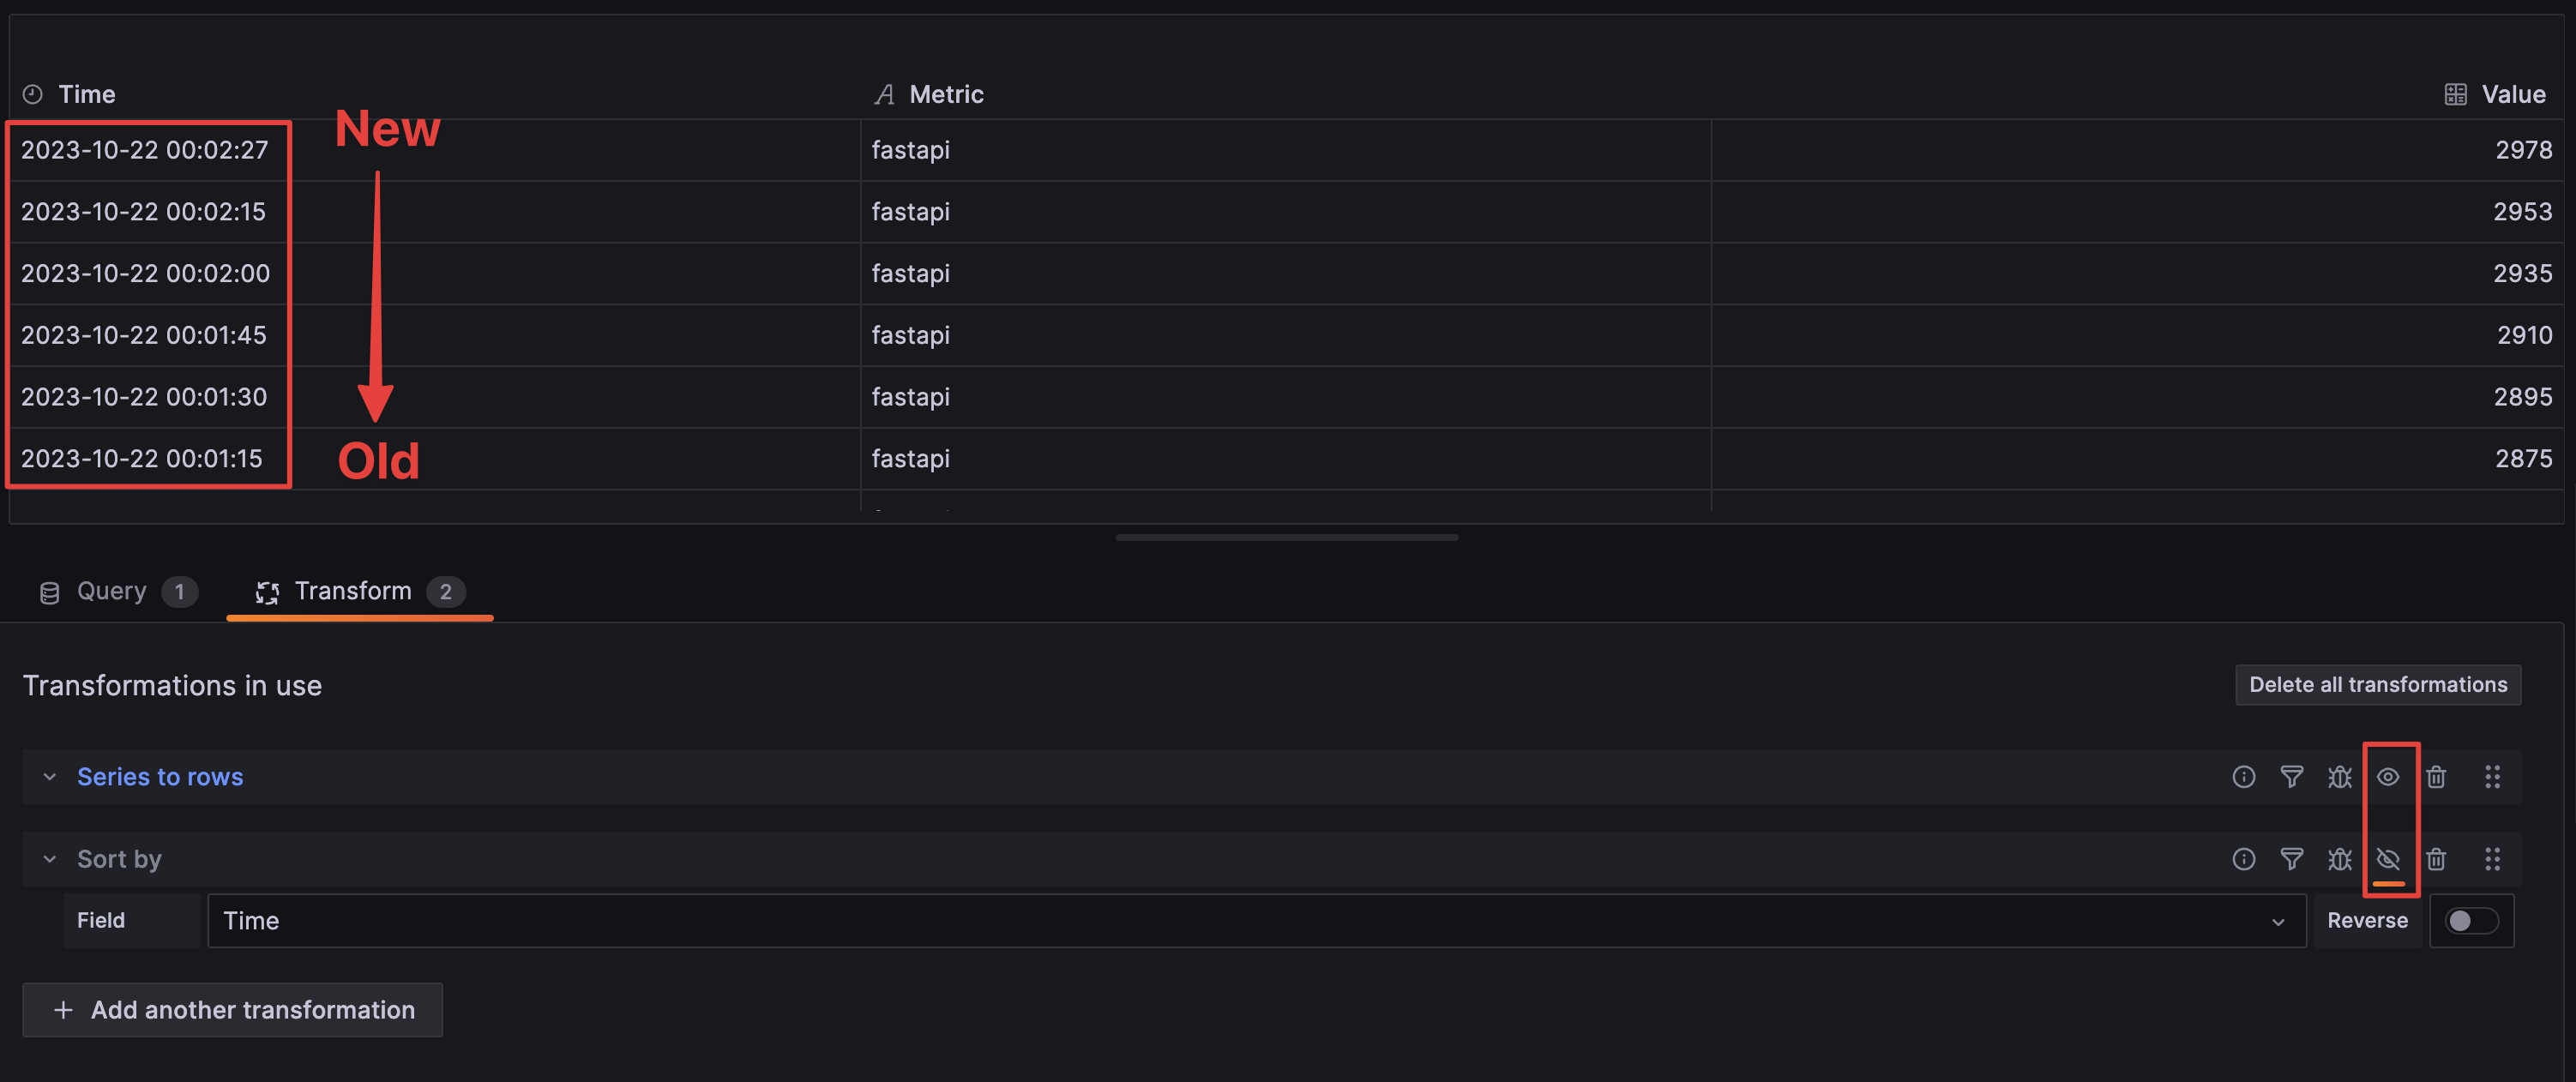
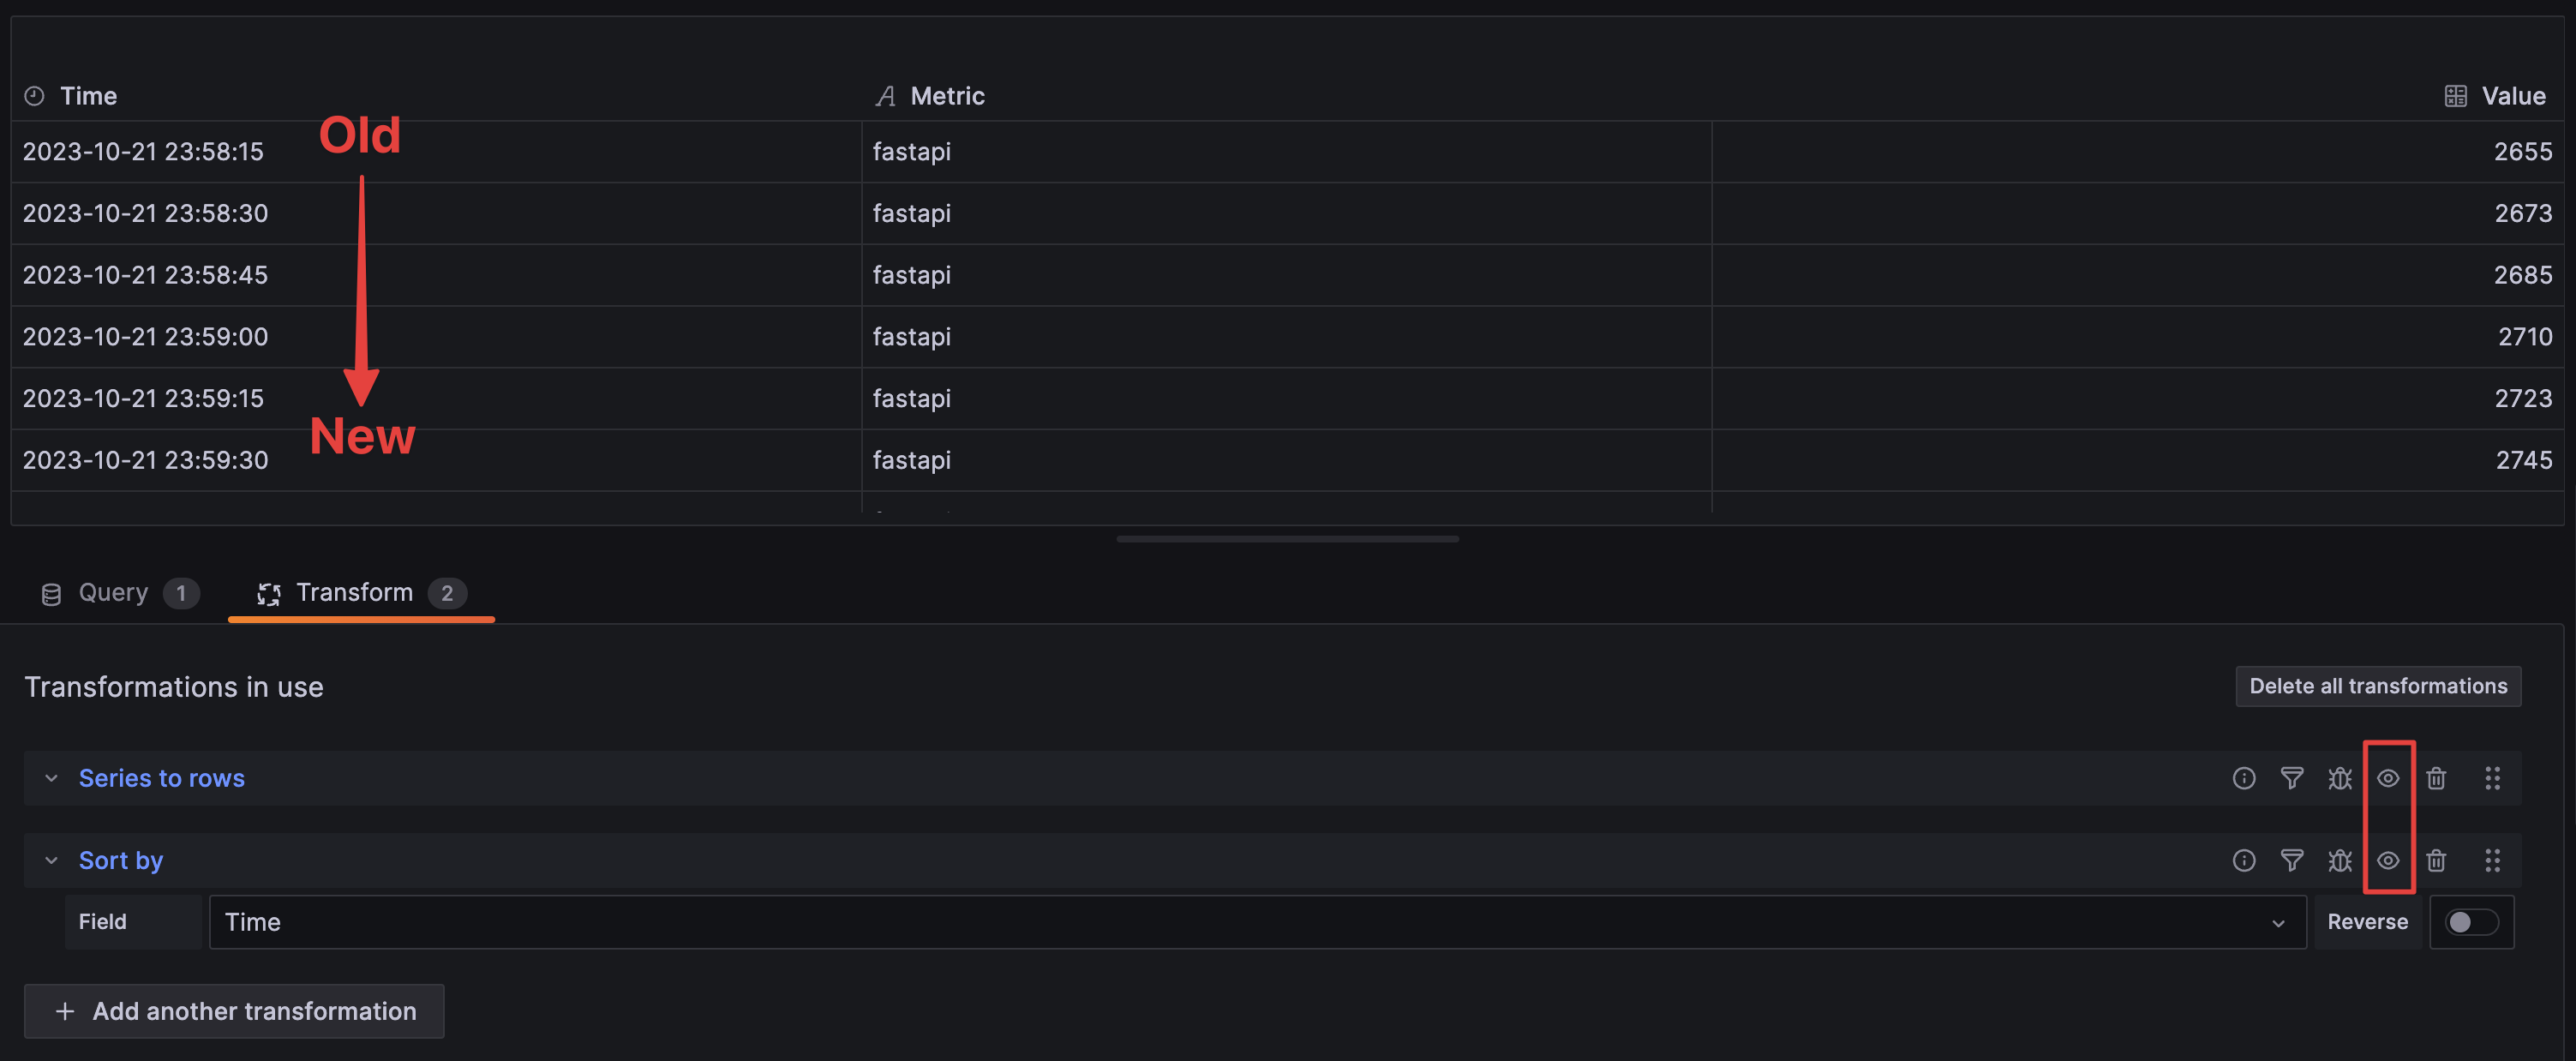
After noticing that all my Stat panels lag behind a couple of minutes when displayed on my dashboard (but not during query building in Explore!), I dug a bit deeper and realized that the last datapoint received by my query isn’t the most recent one (especially in a tiny panel for a 24h range), but up to two intervals to the left; I guess that’s how Prometheus distributes its datapoints?
As a bad workaround, I used the query options in my panel to increase max datapoints to some absurd value (99999 for good measure), to get the step down to a minimum of 5s.
While this works fine enough, I’m requesting a very detailed resolution, only to graph it in a small area and printing the most recent value from it. Since my Prometheus is running on a Raspberry Pi, I want to keep it light and simple.
Then I learned about the difference between Range and Instant queries - since I want to see the Instant value on top of a ranged sparkline, I thought Both would be ideal…
- What happened?
Stat panel can’t seem to merge Both queries, but displaying two Stats - one for the Range result, one for Instant:

Not sure if Both queries are even supposed to be there - at least for Alerting, I found an issue about migrating Both to Range.
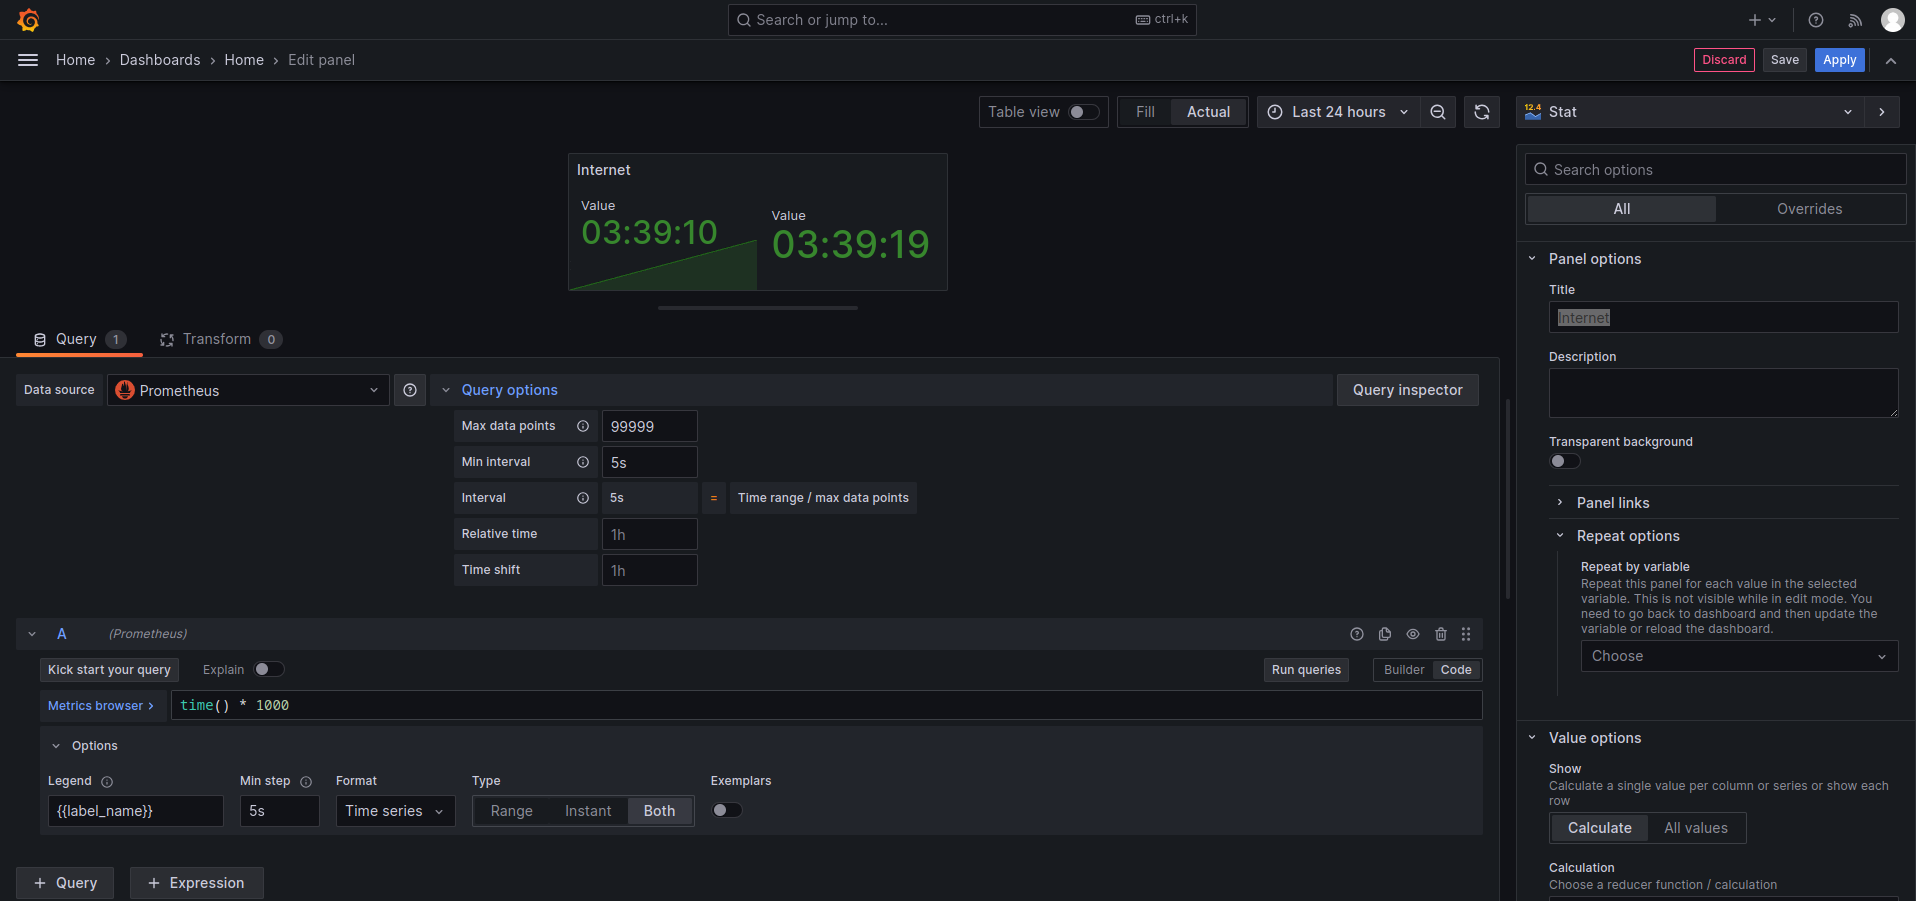
It’s even more interesting with a simple time() * 1000 query, since it’s also showing my issue with the range query not getting the most recent value:
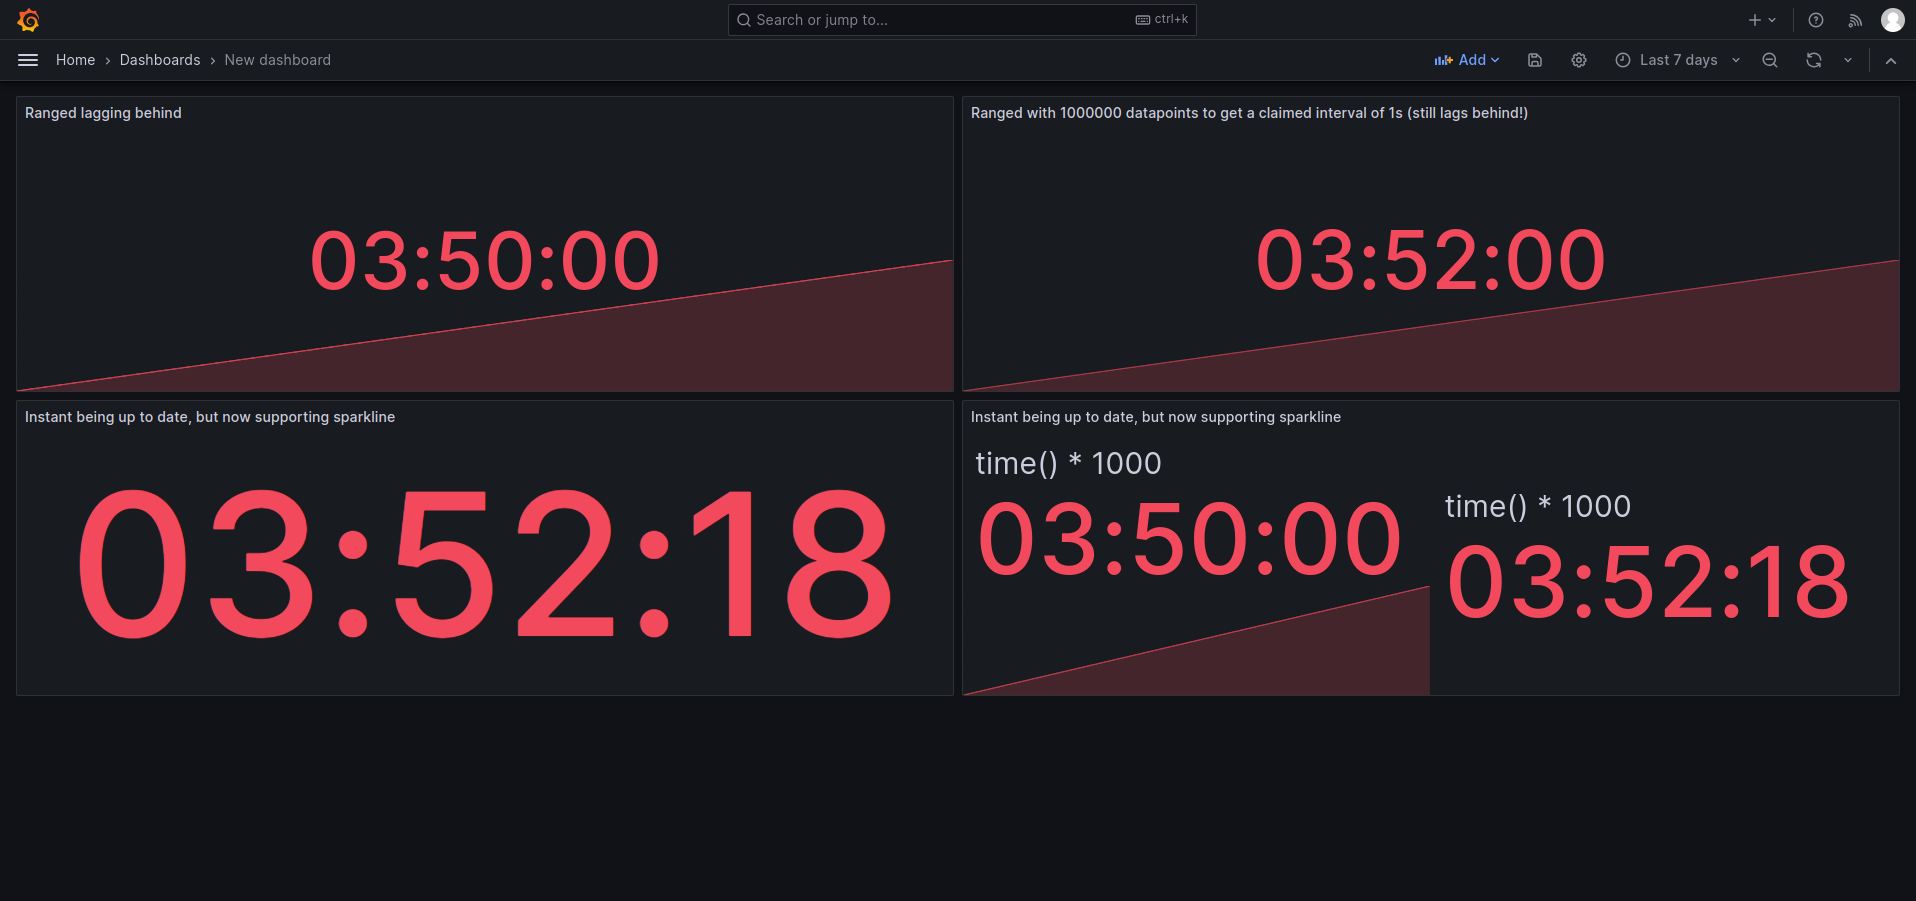
Put together on a dashboard (config see below - “Instant being up to date, but now supporting sparkline” should say “Instant being up to date, but not supporting sparkline”):
- What did you expect to happen?
Without knowing anything, I’d expect it to just work - always showing me the instant value over the sparkline.
After thinking about data points, steps and intervals, I see why that might not be possible with a Range query, but wouldn’t expect more than one interval of delay - in my example building the query, I have a interval and min step of 5s, but getting a difference of 9s between Range and Instant.
And last but not least, I would expect Both to solve my issue, appending the Instant result to the Range one, so only one Stat is shown in the panel - instead of treating them as two completely seperate queries/results/metrics.
- Can you copy/paste the configuration(s) that you are having problems with?
dashboard.json
{
  "annotations": {
    "list": [
      {
        "builtIn": 1,
        "datasource": {
          "type": "grafana",
          "uid": "-- Grafana --"
        },
        "enable": true,
        "hide": true,
        "iconColor": "rgba(0, 211, 255, 1)",
        "name": "Annotations & Alerts",
        "type": "dashboard"
      }
    ]
  },
  "editable": true,
  "fiscalYearStartMonth": 0,
  "graphTooltip": 0,
  "links": [],
  "liveNow": false,
  "panels": [
    {
      "datasource": {
        "type": "prometheus",
        "uid": "prometheus"
      },
      "fieldConfig": {
        "defaults": {
          "color": {
            "mode": "thresholds"
          },
          "mappings": [],
          "thresholds": {
            "mode": "absolute",
            "steps": [
              {
                "color": "green",
                "value": null
              },
              {
                "color": "red",
                "value": 80
              }
            ]
          },
          "unit": "dateTimeAsLocalNoDateIfToday"
        },
        "overrides": []
      },
      "gridPos": {
        "h": 8,
        "w": 12,
        "x": 0,
        "y": 0
      },
      "id": 1,
      "options": {
        "colorMode": "value",
        "graphMode": "area",
        "justifyMode": "auto",
        "orientation": "auto",
        "reduceOptions": {
          "calcs": [
            "lastNotNull"
          ],
          "fields": "",
          "values": false
        },
        "textMode": "auto"
      },
      "pluginVersion": "10.0.2",
      "targets": [
        {
          "datasource": {
            "type": "prometheus",
            "uid": "prometheus"
          },
          "editorMode": "code",
          "expr": "time()  * 1000",
          "instant": false,
          "range": true,
          "refId": "A"
        }
      ],
      "title": "Ranged lagging behind",
      "type": "stat"
    },
    {
      "datasource": {
        "type": "prometheus",
        "uid": "prometheus"
      },
      "fieldConfig": {
        "defaults": {
          "color": {
            "mode": "thresholds"
          },
          "mappings": [],
          "thresholds": {
            "mode": "absolute",
            "steps": [
              {
                "color": "green",
                "value": null
              },
              {
                "color": "red",
                "value": 80
              }
            ]
          },
          "unit": "dateTimeAsLocalNoDateIfToday"
        },
        "overrides": []
      },
      "gridPos": {
        "h": 8,
        "w": 12,
        "x": 12,
        "y": 0
      },
      "id": 2,
      "interval": "1s",
      "maxDataPoints": 1000000,
      "options": {
        "colorMode": "value",
        "graphMode": "area",
        "justifyMode": "auto",
        "orientation": "auto",
        "reduceOptions": {
          "calcs": [
            "lastNotNull"
          ],
          "fields": "",
          "values": false
        },
        "textMode": "auto"
      },
      "pluginVersion": "10.0.2",
      "targets": [
        {
          "datasource": {
            "type": "prometheus",
            "uid": "prometheus"
          },
          "editorMode": "code",
          "expr": "time()  * 1000",
          "instant": false,
          "range": true,
          "refId": "A"
        }
      ],
      "title": "Ranged with 1000000 datapoints to get a claimed interval of 1s (still lags behind!)",
      "type": "stat"
    },
    {
      "datasource": {
        "type": "prometheus",
        "uid": "prometheus"
      },
      "fieldConfig": {
        "defaults": {
          "color": {
            "mode": "thresholds"
          },
          "mappings": [],
          "thresholds": {
            "mode": "absolute",
            "steps": [
              {
                "color": "green",
                "value": null
              },
              {
                "color": "red",
                "value": 80
              }
            ]
          },
          "unit": "dateTimeAsLocalNoDateIfToday"
        },
        "overrides": []
      },
      "gridPos": {
        "h": 8,
        "w": 12,
        "x": 0,
        "y": 8
      },
      "id": 4,
      "options": {
        "colorMode": "value",
        "graphMode": "area",
        "justifyMode": "auto",
        "orientation": "auto",
        "reduceOptions": {
          "calcs": [
            "lastNotNull"
          ],
          "fields": "",
          "values": false
        },
        "textMode": "auto"
      },
      "pluginVersion": "10.0.2",
      "targets": [
        {
          "datasource": {
            "type": "prometheus",
            "uid": "prometheus"
          },
          "editorMode": "code",
          "exemplar": false,
          "expr": "time()  * 1000",
          "instant": true,
          "range": false,
          "refId": "A"
        }
      ],
      "title": "Instant being up to date, but now supporting sparkline",
      "type": "stat"
    },
    {
      "datasource": {
        "type": "prometheus",
        "uid": "prometheus"
      },
      "fieldConfig": {
        "defaults": {
          "color": {
            "mode": "thresholds"
          },
          "mappings": [],
          "thresholds": {
            "mode": "absolute",
            "steps": [
              {
                "color": "green",
                "value": null
              },
              {
                "color": "red",
                "value": 80
              }
            ]
          },
          "unit": "dateTimeAsLocalNoDateIfToday"
        },
        "overrides": []
      },
      "gridPos": {
        "h": 8,
        "w": 12,
        "x": 12,
        "y": 8
      },
      "id": 3,
      "options": {
        "colorMode": "value",
        "graphMode": "area",
        "justifyMode": "auto",
        "orientation": "auto",
        "reduceOptions": {
          "calcs": [
            "lastNotNull"
          ],
          "fields": "",
          "values": false
        },
        "textMode": "auto"
      },
      "pluginVersion": "10.0.2",
      "targets": [
        {
          "datasource": {
            "type": "prometheus",
            "uid": "prometheus"
          },
          "editorMode": "code",
          "exemplar": false,
          "expr": "time()  * 1000",
          "instant": true,
          "range": true,
          "refId": "A"
        }
      ],
      "title": "Instant being up to date, but now supporting sparkline",
      "type": "stat"
    }
  ],
  "refresh": "",
  "schemaVersion": 38,
  "style": "dark",
  "tags": [],
  "templating": {
    "list": []
  },
  "time": {
    "from": "now-7d",
    "to": "now"
  },
  "timepicker": {},
  "timezone": "",
  "title": "New dashboard",
  "version": 0,
  "weekStart": ""
}
Am I misunderstanding anything major, is this just not supported, or the Stat panel not being able to render Both queries a bug?