I would like to view my consumption data from a date in the middle of last year. But under Query Options I can only set 1y, 2y, … and not the fixed date. This display is part of a larger view that should remain set to “last 7 days”.

Can you specify the start date in your query?


Hi @dgr75
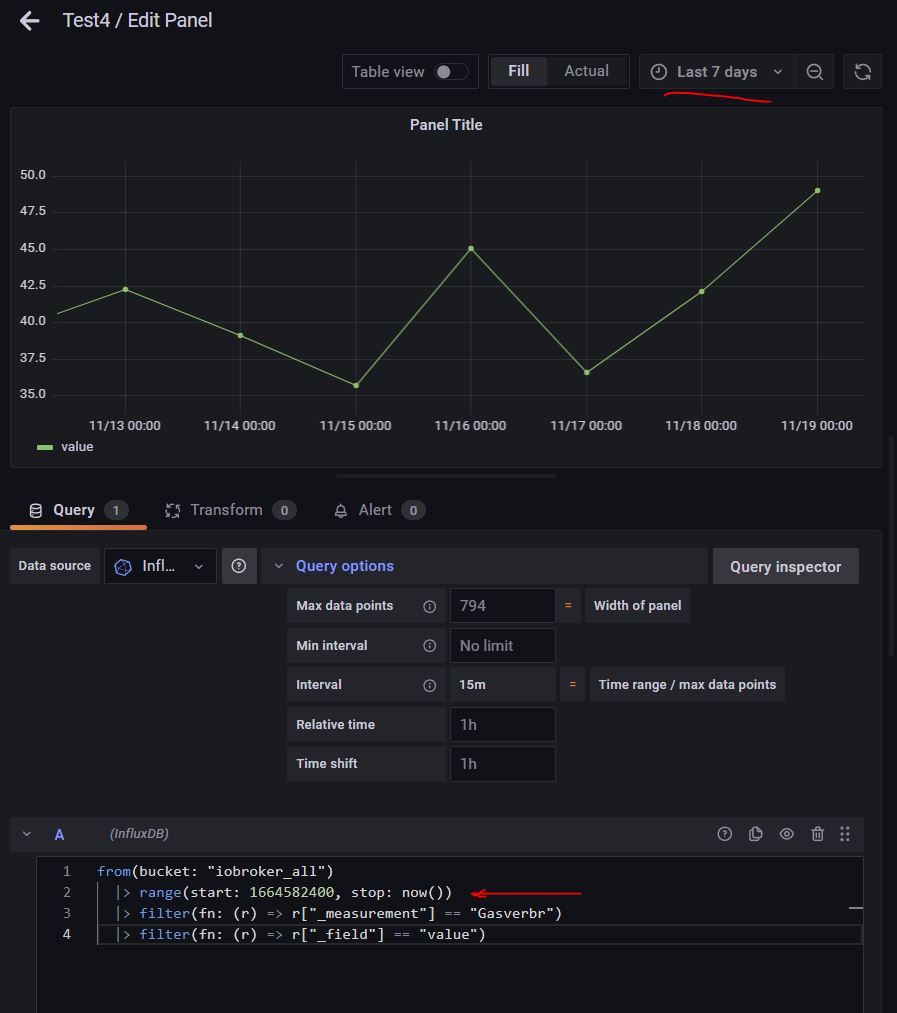
I meant to specify the start date (2022-10-01) in your Influx query, like this:
|> range(start: 1664582400, stop: now())


When I tested it again, I found that the time period information was implemented with different priorities.
The value under Query options “Relative time” has the highest priority
If there is no value there, then the value under Time range (here “Last 7 days”) is taken.
The information in the example
|> range(start: 1664582400, stop: now())
has no effect on me.

Hi @dgr75
Are you saying that when you use absolute time in the range function of your query, and there is nothing in Query options >> relative time, you are not able to get a graph of your data?
Here is some data that I had where I specified a 10-day range in October.


