Hi,
I´m trying to get started with grafana, telegraf and influx and have configured everything and assume it is working but not one Dashboard from Grafana is working.
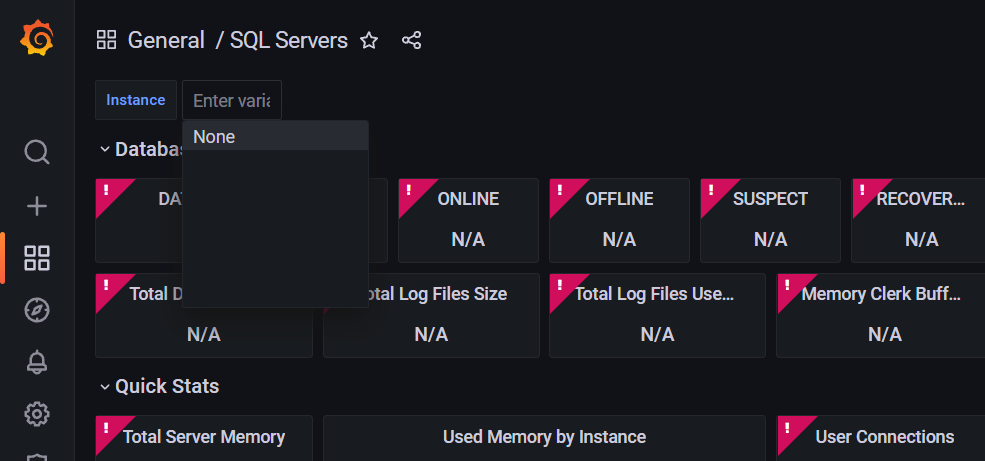
I can confirm that data is written from telegraf to influxdb and i can access the data from grafana. But in the Dashboard i have always some sort of dropdown. So for example “sql_instance” and in influxdb there are values. But in Grafana it is empty?

The query for slecting the instances is : “SHOW TAG VALUES WITH KEY = “sql_instance””
If i execute this query in the “Explore” section i get this message:
Query error
invalid: error @1:1-1:5: undefined identifier SHOW
Any tips what i am doing wrong?