Title: Dashboard Panel Shows Cached Data Instead of Updating with New Variable Values
Environment:
Grafana version: 11.4.0
Docker deployment
PostgreSQL datasources
Multiple panels with variables
Issue:
When interacting with dashboard panels using variables, the panels show cached data instead of updating with new variable selections. Specifically:
Initial load of panel with Variable A = X shows correct data
Change Variable A to Y
Panel continues showing data from previous variable selection (X)
Manual refresh required to see correct data for new variable selection (Y)
Panel retains old data instead of updating with new variable
Manual browser refresh required to see updated data
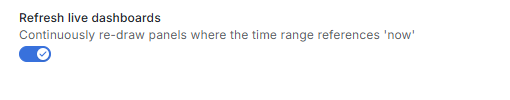
Expected Behavior:
Panel should automatically refresh and show new data when variables change
No manual refresh should be required to see updated data based on new variable selections
The issue appears after upgrading from Grafana 11.2.5 to newer versions - while dashboard panels refresh correctly with variable changes in 11.2.5, versions 11.3.0 and above require manual refresh to display updated data.
Is there a solution to make panels automatically refresh with variable changes in Grafana versions newer than 11.2.5, similar to how it worked in 11.2.5? I’ve tried adding cacheTimeout, refresh parameters, and query hints, but these haven’t resolved the issue.
I would like to kindly ask you not to use generative artificial intelligence (a.k.a. GPT, LLM, generative AI, genAI) tools to generate content here. You can see that this is pure AI hallucination in this case. I don’t see this AI hallucination problem with your answers first time.
ok for next time i will post in this category for experimantal suggestion i just google and see to top suggest as a post suggestion to problem.
thank remember this …
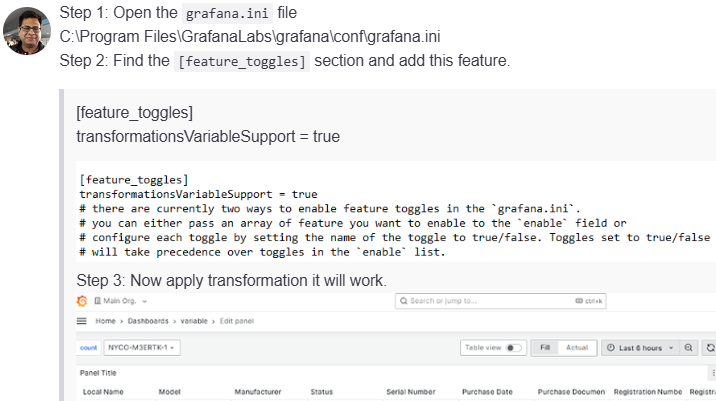
so @infofcc3 when you see the term experimental, it is on grafana’s side of things meaning grafana is trying out something early in their development lifecycle
It does not mean you experimenting if something will work or not just by randomly adding it to the ini