Hello ![]() ,
,
I’m using elastic search as datasource in grafana. This are my elastic search documents.

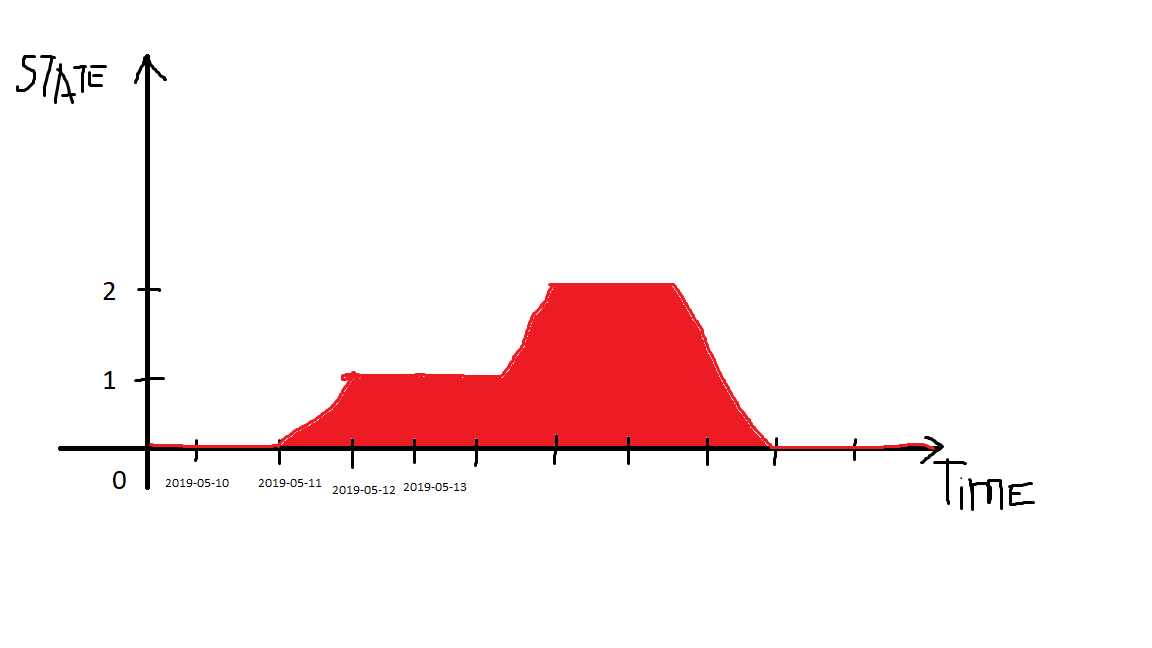
I want to display area plot. On y-axis i want to have State and on x-axis i want to have TimeFrom.DateTime. I don’t know how to achieved this because i don’t know if is possible to put on y-axis just integer without metric. Basically i want create plot that will show how client states are changing over time. Is this possible ?
This is how i image my plot. (sorry for ugly plot. It’s drawn in paint ![]() )
)