am trying to create a graph am datasource is postgresql.
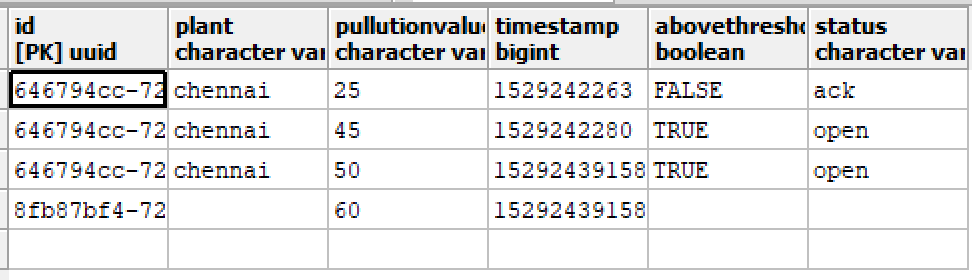
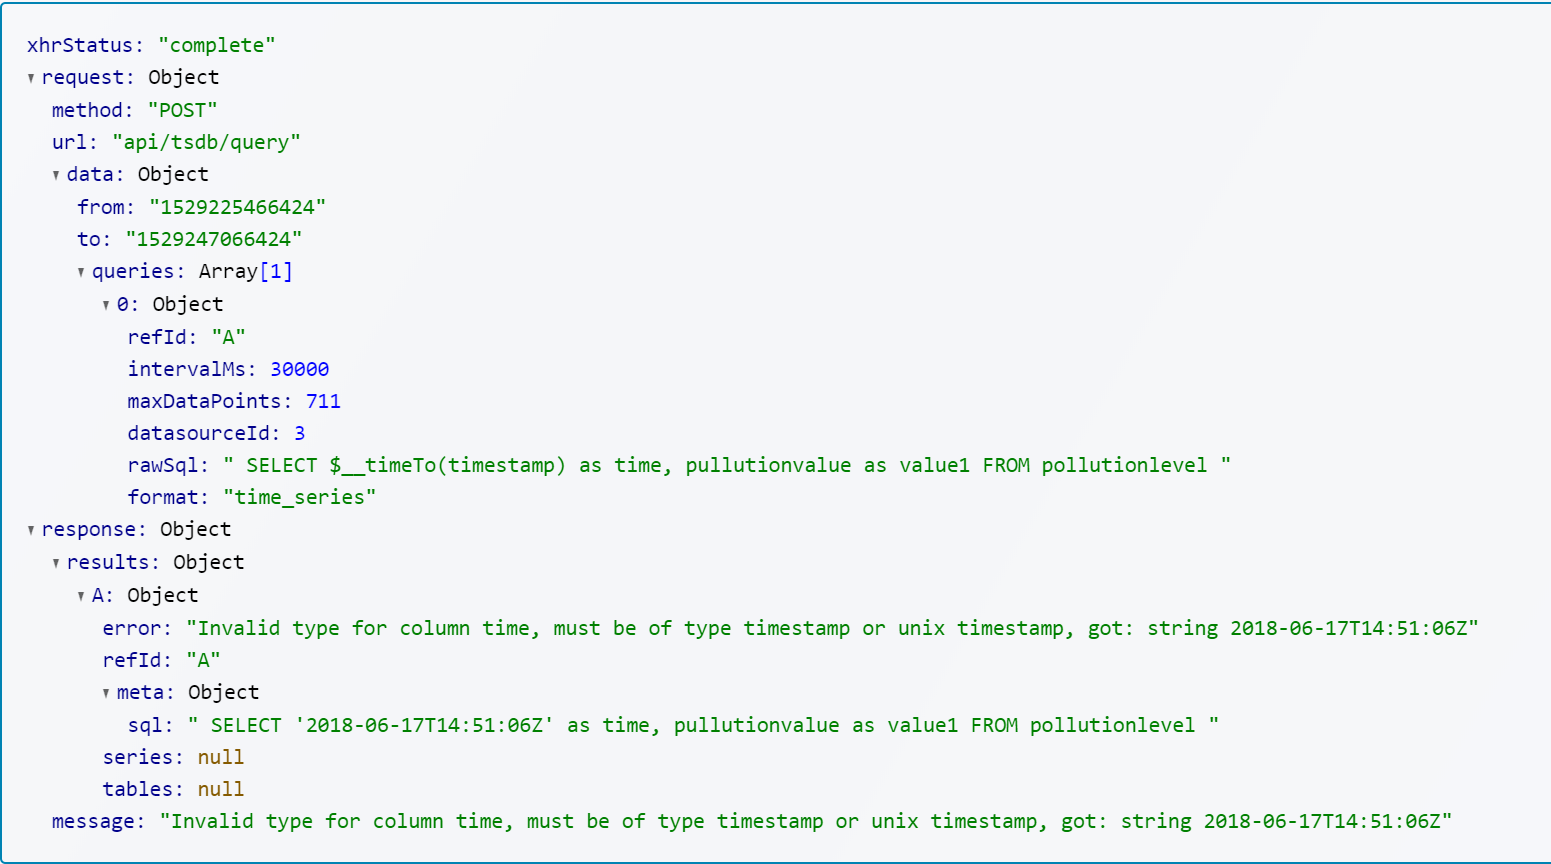
No graph is getting plotted when i run the query.Attached is the response that i get when the query is executed for timeseries format.Alsoattahed the screenshot of my table data.
my query is:
SELECT
$__timeTo(timestamp) as time,
pullutionvalue as value1
FROM
pollutionlevel
below is the response that i get when i execute the query for table format
xhrStatus:“complete”
request:Object
method:“POST”
url:“api/tsdb/query”
data:Object
from:“1529225426245”
to:“1529247026245”
queries:Array[1]
0:Object
refId:“A”
intervalMs:30000
maxDataPoints:711
datasourceId:3
rawSql:" SELECT $__timeTo(timestamp) as time, pullutionvalue as value1 FROM pollutionlevel "
format:“table”
response:Object
results:Object
A:Object
refId:“A”
meta:Object
rowCount:4
sql:" SELECT ‘2018-06-17T14:50:26Z’ as time, pullutionvalue as value1 FROM pollutionlevel "
series:null
tables:Array[1]
0:Object
columns:Array[2]
0:Object
text:“time”
1:Object
text:“value1”
rows:Array[4]
0:Array[2]
0:“2018-06-17T14:50:26Z”
1:“25”
1:Array[2]
0:“2018-06-17T14:50:26Z”
1:“45”
2:Array[2]
0:“2018-06-17T14:50:26Z”
1:“50”
3:Array[2]
0:“2018-06-17T14:50:26Z”
1:“60”