-
What Grafana version and what operating system are you using?
v12.0.1 -
What are you trying to achieve?
Create a dashboard from API -
How are you trying to achieve it?
Making an API call Dashboard HTTP API | Grafana documentation -
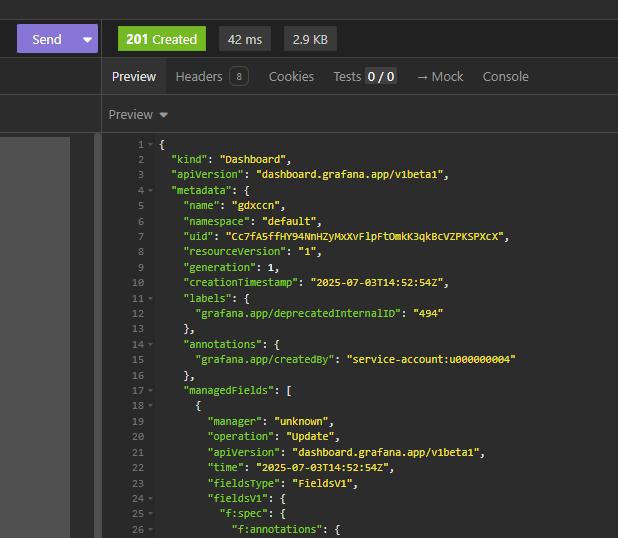
What happened?
Got HTTP/1.1 422 Unprocessable Entity -
What did you expect to happen?
Dashboard createad -
Can you copy/paste the configuration(s) that you are having problems with?
The command I’m running is:
$ https -A bearer -a $token POST https://tech-platforms-monitoring-dev.eu.boehringer.com/apis/dashboard.grafana.app/v1beta1/namespaces/default/dashboards < local_docker_build/files/sources/dashboards/CompBio/default.json
the default.json dashboard is json dump from grafana 11.
{
  "annotations": {
    "list": [
      {
        "builtIn": 1,
        "datasource": {
          "type": "grafana",
          "uid": "-- Grafana --"
        },
        "enable": false,
        "hide": true,
        "iconColor": "rgba(0, 211, 255, 1)",
        "name": "Annotations & Alerts",
        "type": "dashboard"
      }
    ]
  },
  "editable": true,
  "fiscalYearStartMonth": 0,
  "graphTooltip": 0,
  "id": 20,
  "links": [],
  "panels": [
    {
      "fieldConfig": {
        "defaults": {},
        "overrides": []
      },
      "gridPos": {
        "h": 13,
        "w": 24,
        "x": 0,
        "y": 0
      },
      "id": 1,
      "options": {
        "code": {
          "language": "plaintext",
          "showLineNumbers": false,
          "showMiniMap": false
        },
        "content": "# Tech Platforms grafana\n\nWelcome to the TechPlatforms grafana portal.\n\nUnder the [Dashboard section](https://tech-platforms-monitoring-dev.eu.boehringer.com/dashboards) you'll find some dashboard for some of most relevant services :\n- Batch: \n  - CBCF AWS Batch Compute Cost: cost related information for the Batch jobs executed in AWS\n  - ECR: List of vulnerabilities for each image stored in AWS ECR\n  - Seqera Platform (EDP): Basic information in regards roles for the NF-Tower platform.\n- Data:\n  - CompBio AWS Data: CBCF S3 Data. Buckets and sizes.\n  - Exchange buckets: CBCF xchange bucket information.\n  - On premise data: NetApp as data source. You can get insights of /data/gcbds\n  - File System Analytics: NetApp as data source. You can get insights of directories in /data/gcbds\n- Posit:\n  - Posit Connect: Information related to users, apps and sessions in Connect\n  - Posit WorkBench: Information related to users and sessions for WorkBench\n\nThe Dashboard under TechPltaforms are IT related and you should not be interested on them.\nIn case of doubts or requests you can contact us using the [demand portal](https://confluence.biscrum.com/pages/viewpage.action?pageId=449901734)\n",
        "mode": "markdown"
      },
      "pluginVersion": "11.5.1",
      "title": "Welcome to Tech Platforms grafana",
      "type": "text"
    }
  ],
  "preload": false,
  "refresh": "",
  "schemaVersion": 40,
  "tags": [],
  "templating": {
    "list": []
  },
  "time": {
    "from": "now-6h",
    "to": "now"
  },
  "timepicker": {},
  "timezone": "",
  "title": "Welcome",
  "uid": "welcomedashboard",
  "version": 1,
  "weekStart": ""
}
- Did you receive any errors in the Grafana UI or in related logs? If so, please tell us exactly what they were.
HTTP/1.1 422 Unprocessable Entity
audit-id: 56bed901-7433-44f0-ae8c-4cd45c9e5d8a
cache-control: no-store
content-length: 590
content-type: application/json
date: Thu, 03 Jul 2025 06:31:41 GMT
set-cookie: 3c6b03e400c78a6b962e6f901fb8c963=d41cf7a31db14d7b382034767e7dd53d; path=/; HttpOnly; Secure; SameSite=None
warning: 299 - "unknown field \"annotations\"", 299 - "unknown field \"editable\"", 299 - "unknown field \"fiscalYearStartMonth\"", 299 - "unknown field \"graphTooltip\"", 299 - "unknown field \"id\"", 299 - "unknown field \"links\"", 299 - "unknown field \"panels\"", 299 - "unknown field \"preload\"", 299 - "unknown field \"refresh\"", 299 - "unknown field \"schemaVersion\"", 299 - "unknown field \"tags\"", 299 - "unknown field \"templating\"", 299 - "unknown field \"time\"", 299 - "unknown field \"timepicker\"", 299 - "unknown field \"timezone\"", 299 - "unknown field \"title\"", 299 - "unknown field \"uid\"", 299 - "unknown field \"version\"", 299 - "unknown field \"weekStart\""
x-content-type-options: nosniff
x-xss-protection: 1; mode=block

{
    "apiVersion": "v1",
    "code": 422,
    "details": {
        "causes": [
            {
                "field": "spec",
                "message": "Invalid value: \"\": dashboard schema version 0 cannot be migrated to latest version 41 - migration path only exists for versions greater than 36",
                "reason": "FieldValueInvalid"
            }
        ],
        "group": "dashboard.grafana.app",
        "kind": "Dashboard"
    },
    "kind": "Status",
    "message": "Dashboard.dashboard.grafana.app \"\" is invalid: spec: Invalid value: \"\": dashboard schema version 0 cannot be migrated to latest version 41 - migration path only exists for versions greater than 36",
    "metadata": {},
    "reason": "Invalid",
    "status": "Failure"
}

```

* Did you follow any online instructions? If so, what is the URL?

https://grafana.com/docs/grafana/latest/developers/http_api/dashboard/#create-dashboard

Thanks