What Grafana version and what operating system are you using?
Latest Grafana on RHEL
What are you trying to achieve?
Add a panel that shows CPUUtilization for each instance in an auto-scaling group
How are you trying to achieve it?
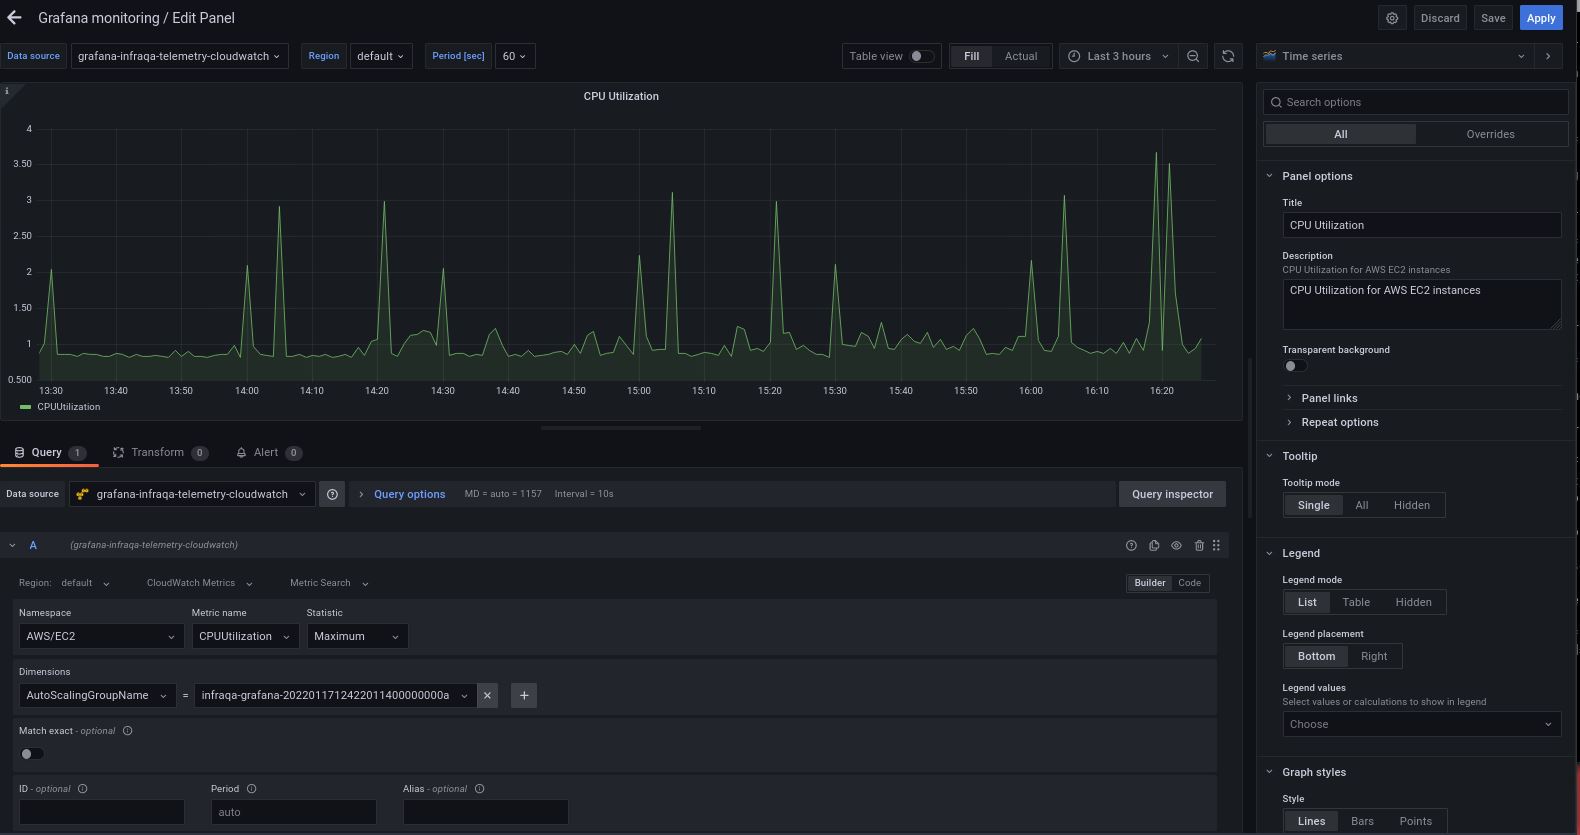
Please see attached screenshot
What happened?
Only one metric is shown on the graph
What did you expect to happen?
Multiple metrics shown on the graph, one for each instance
Can you copy/paste the configuration(s) that you are having problems with?
Please see attached screenshot
Did you receive any errors in the Grafana UI or in related logs? If so, please tell us exactly what they were.
No
Did you follow any online instructions? If so, what is the URL?
Tried many different things on the internet…
Please note the CloudWatch source is working fine. Also, when using metrics exported by Telegraf, we immediately see one metric pre instance, for example for disk usage.
So after some research, I am quite sure the problem is that the AWS/EC2 metric CPUUtilization has no dimension named AutoScalingGroupName . Consequently, we can’t filter on the AutoScalingGroupName for instances’ CPUUtilization .
Confusingly, autoscaling groups publish a metric also named CPUUtilization , which is an aggregate of the CPU utilization for all the instances in the group. Now this metric does have a dimension named AutoScalingGroupName , explained here, so when we filter based on the autoscaling group name, that’s the metric we are seeing, not the per-instance CPU utilization.
As far as I can see, the CPUUtilization published by AWS for each EC2 instance has only one metric: the instance id. That’s not enough for Grafana to filter on the autoscaling group name. In our organisation, we had to use a metric exported by an agent running on the instances.