I have a table machines_records_full in MySQL
describe machines_records_full;

I’m trying to build a graph in Grafana for the last 6 hours:
SELECT
  time AS "time",
  lamp,
  tube
FROM machines_records_full
WHERE
  time BETWEEN FROM_UNIXTIME($__unixEpochFrom()) AND FROM_UNIXTIME($__unixEpochTo()) AND
  machine_id = 1
ORDER BY time;
Everything works well
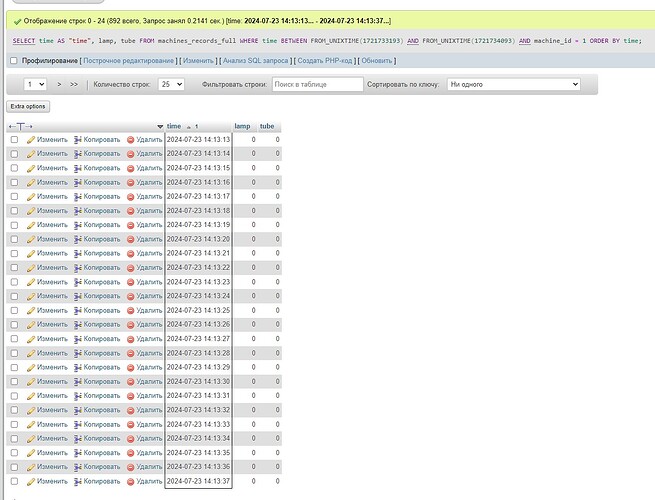
But when I select a different time period, for example, for the last 15 minutes, the graph is not displayed
Although the request to MySQL returns data:


