Cannot display data on timeseries

Hi, all,

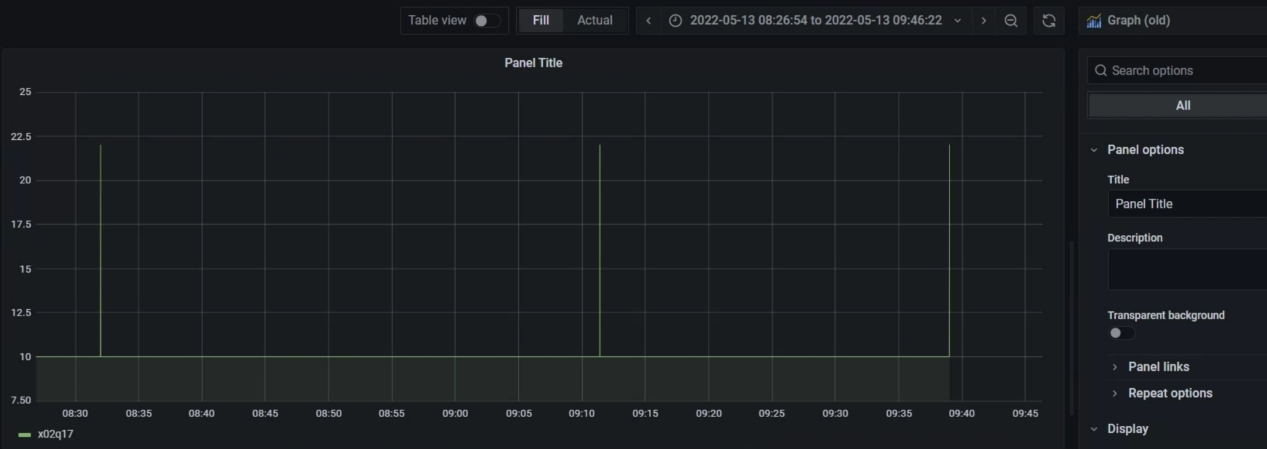
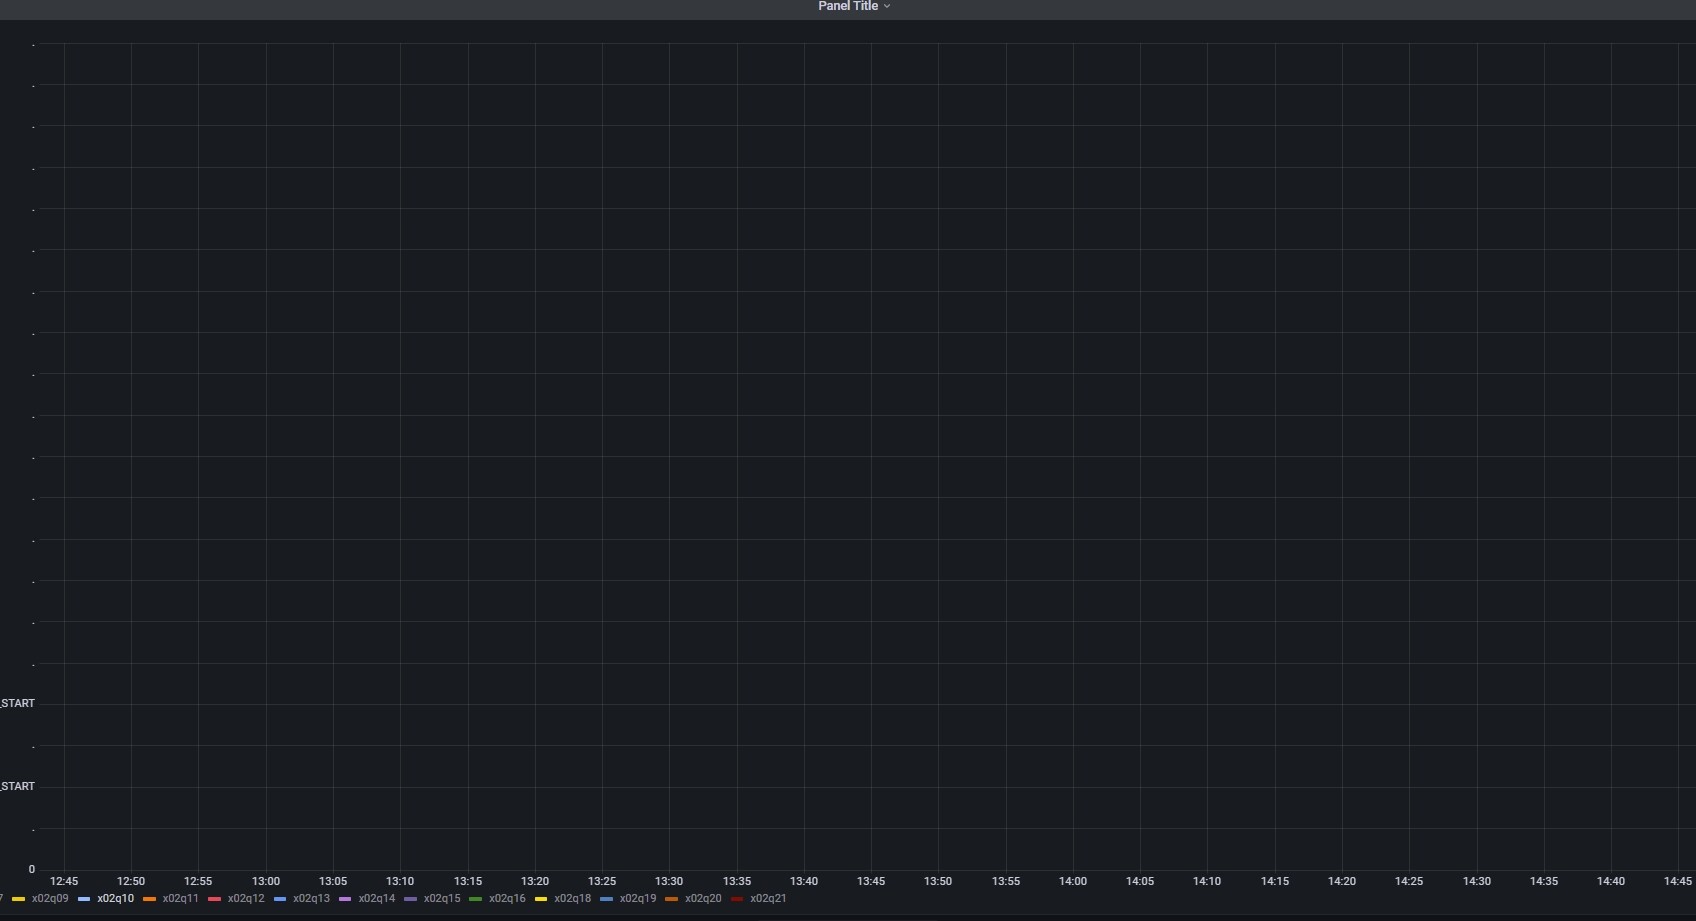
I have a set of data that “Time Series” display nothing but it can display in “Graph (old)”
From Table View, the data’s format is totally correct
My version of Grafana is 8.4.3 (StandaloneEnt. version running on Windows)

The “Time Series” shows nothing and graph setting

“Graph (old)” can show line chart

The set of data

‘2022-05-13 09:11:25.000’,10
‘2022-05-13 09:11:24.716’,20
‘2022-05-13 09:11:24.000’,10
‘2022-05-13 08:32:00.000’,10
‘2022-05-13 08:31:59.920’,20
‘2022-05-13 08:31:59.000’,10
‘2022-05-13 08:00:19.000’,10
‘2022-05-13 08:00:18.283’,20
‘2022-05-13 08:00:18.000’,10
‘2022-05-13 07:25:07.000’,10
‘2022-05-13 07:25:06.466’,20
‘2022-05-13 07:25:06.000’,10
‘2022-05-13 06:55:00.000’,10
‘2022-05-13 06:54:59.950’,20
‘2022-05-13 06:54:59.000’,10
‘2022-05-13 06:21:00.000’,10
‘2022-05-13 06:20:59.943’,20
‘2022-05-13 06:20:59.000’,10
‘2022-05-13 05:51:00.000’,10
‘2022-05-13 05:50:59.926’,20
‘2022-05-13 05:50:59.000’,10
‘2022-05-13 05:22:00.000’,10
‘2022-05-13 05:21:59.923’,20
‘2022-05-13 05:21:59.000’,10
‘2022-05-13 04:50:00.000’,10
‘2022-05-13 04:49:59.983’,20
‘2022-05-13 04:49:59.000’,10

Hi there.

What kind of datasource are you using?

Are you using the same datasource for both panels?

I didn’t change data source , I’ve just change graph type between “Time Series” & “Graph (old)”
I use simple custom datasource plugin returning JSON data

And the same custom data source can display the following set of data in “Time Series” without problem

|2022-05-13 13:30:57.093|1.0|
|2022-05-13 13:30:27.093|1.0|
|2022-05-13 13:29:57.093|1.0|
|2022-05-13 13:29:57.476|2.3|
|2022-05-13 13:29:27.093|1.0|
|2022-05-13 13:28:57.093|1.0|
|2022-05-13 13:28:27.093|1.0|
|2022-05-13 13:27:57.093|1.0|
|2022-05-13 13:27:27.093|1.0|
|2022-05-13 13:27:07.093|2.0|
|2022-05-13 13:26:57.093|1.0|

Understood. That is indeed odd.

Would you try to use the random generated data from grafana on both panels and see if you get at least a visualization on them?

By random generated data i mean --Grafana-- datasource on the panel. This is just to test if its an issue of the panel itself

Many thanks … I’ve got some interesting findings
I finally found my data by choosing 6-hours ago in time picker

However , when I zoom , the graph is gone (12:45 to 14:40 should have data, from above graph

I found , timeseries cannot display when the series data at that time point is “NaN”
Another problem is it seems it does not deal with DST saving timezone correctly (without taken in account of datetime saving offest)