Hello folks,
I am trying to visualize our test results. I would like to plot data from two (or potentially more) devices into one graph with one curve representing each device. The data comes from a test, is stored in a single Postgresql DB table and looks something like this:
Timestamp | Device | CPU_Load
01/19/2022 11:08:55 | Device 1 | 90
01/19/2022 11:08:56 | Device 1 | 85
01/19/2022 11:08:55 | Device 2 | 10.5
01/19/2022 11:08:56 | Device 2 | 10.5
The problem I am having is that the devices have the same timestamp meaning I have two values connected to one timestamp. Therefore, the resulting graph looks understandly like this:
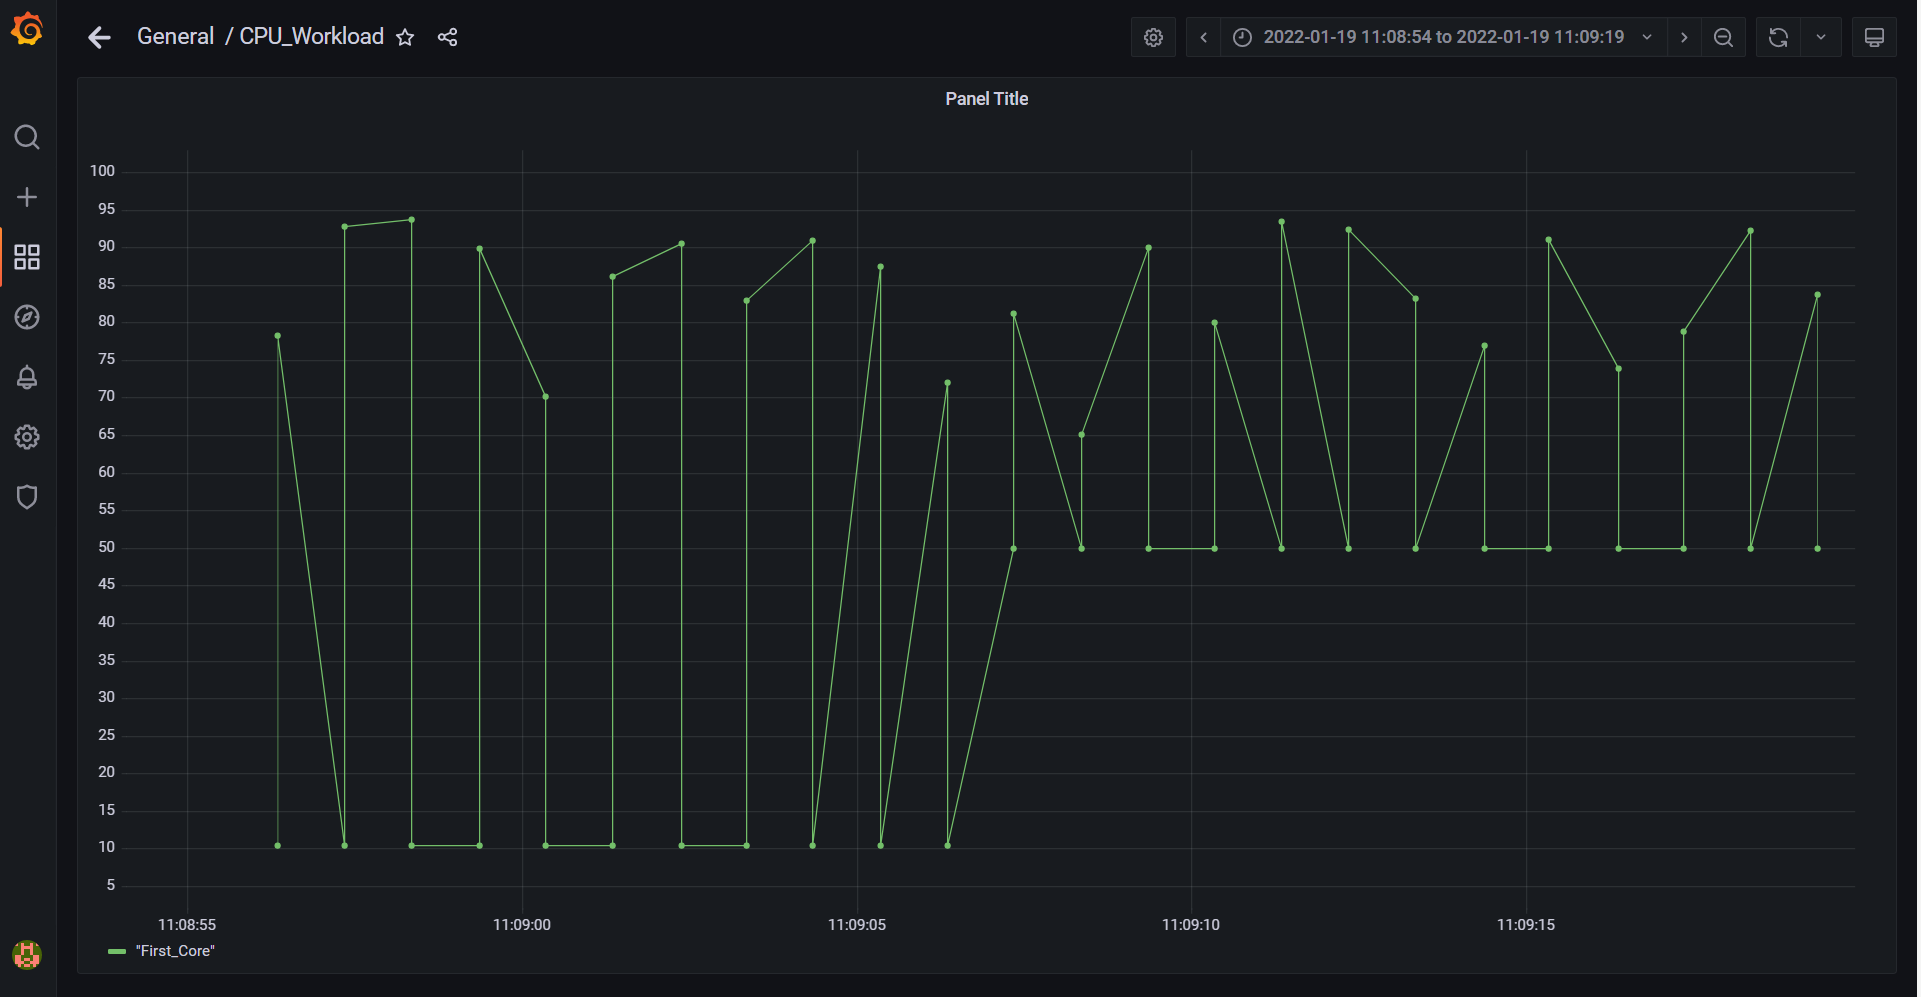
However, I would like to have each device represented by one curve, so for example if I had two devices, I would have two curves.
I have looked into a simillar question (link here) and I have realized I could just simply create a new query for each device with a WHERE condition. However, for my purpose it would be highly impractical, because the number of devices we use for our test varies with time. Sometimes it can be 100 for example and writing 100 querries seems to be too much.
Is there any possbility to “tell” Grafana to split the data point into two curves with a single query?
Grafana version:
v8.3.4
DB:
Postgresql v11