What Grafana version and what operating system are you using?
10.2.2
I’ve finally built op enough of an (influxDB) dataset of sensor readings to effectively use Grafana to analyse them. Loving it so far, the power of the queries/transformations is amazing!
One thing I’m running into, is that the sensor readings are stored only on change of the value. That means, that not at all timestamps, all sensors record a value in the database.
I’m trying to visualize the subtraction of two values, and that makes the above an issue I haven’t been able to resolve. Sample table:
All I can manage, is that the transformation (subtraction) is only done when both sensors register at the same timestamp. When only one registers a value, no translation value is calculated/plotted.
What I would like, is that if one of the sensors doesn’t register on a timestamp, the transformation would use the last value. So in the above table, it would for sensor 2 use value 31 at 1417. And at 1418 for sensor 1 use 36.
I’ve tried grouping but can’t get the result I’m looking for. Any way to do this?
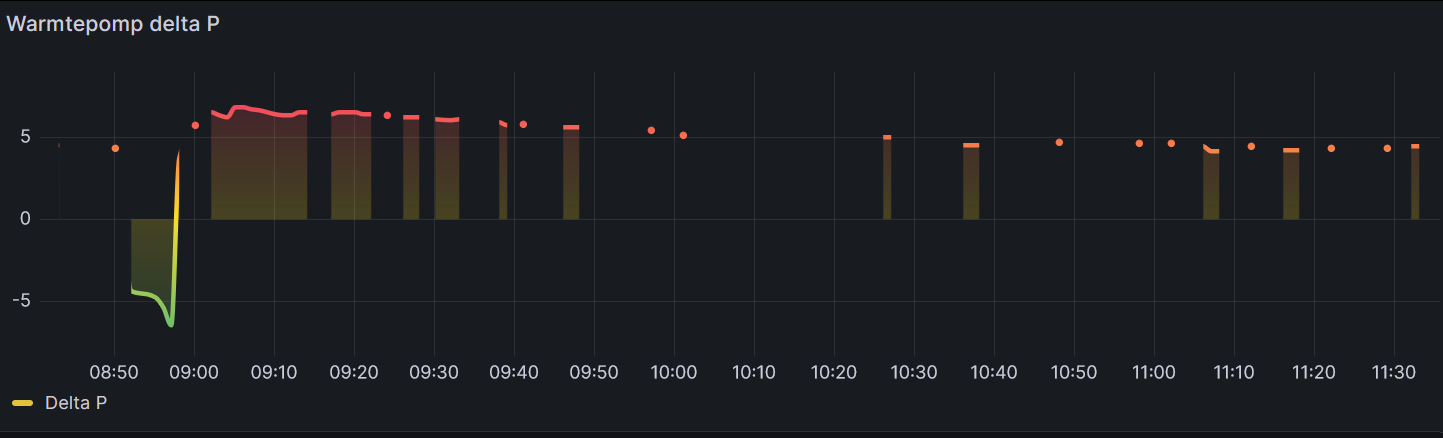
As you can see, the only Delta Temp that’s plotted, are where both A and B have a value with the same timestamp… I’d like to use the last known value for them.
It’s pretty straightforward in both InfluxQL and Flux to obtain the last value, but the second to last value is a bit trickier. The solution can be found here.