Hello,
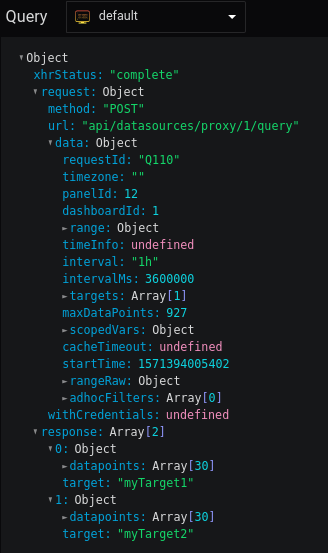
I’m using Simple Json as datasource for visualize a simple graph with 2 series. This is my query from Query Inspector:
And this is the graph that I retrieve (after few options)

As you can see I think there is a visualisation bug with the option “All series”. In fact, if I move hover a point near the centre (like in the picture), the graph shows the values associated at the last point. Furthermore, If I move hover a point to the right of the centre, the graph shows the values of the first point.
Other question, that is not a bug, in the Y axys, is possible to set the interval of the graph lines every hour (not with thresholds)? like 0, 01:00:00, 02:00:00 ecc
I’m using Grafana v6.4.3
Thank you in advance