I have latest Alloy + Mimir Distributed + Grafana + Loki (the latter isn’t relevant here).
Alloy scrapes metrics and pushes them into Mimir Prometheus endpoint.
Metrics get processed errors and warnings are few, nothing remarkable.
However, there is something extremely bizarre going with Mimir querier. For last 6 hrs I get full graphs for metrics series. For last 3hrs I get barely any data.
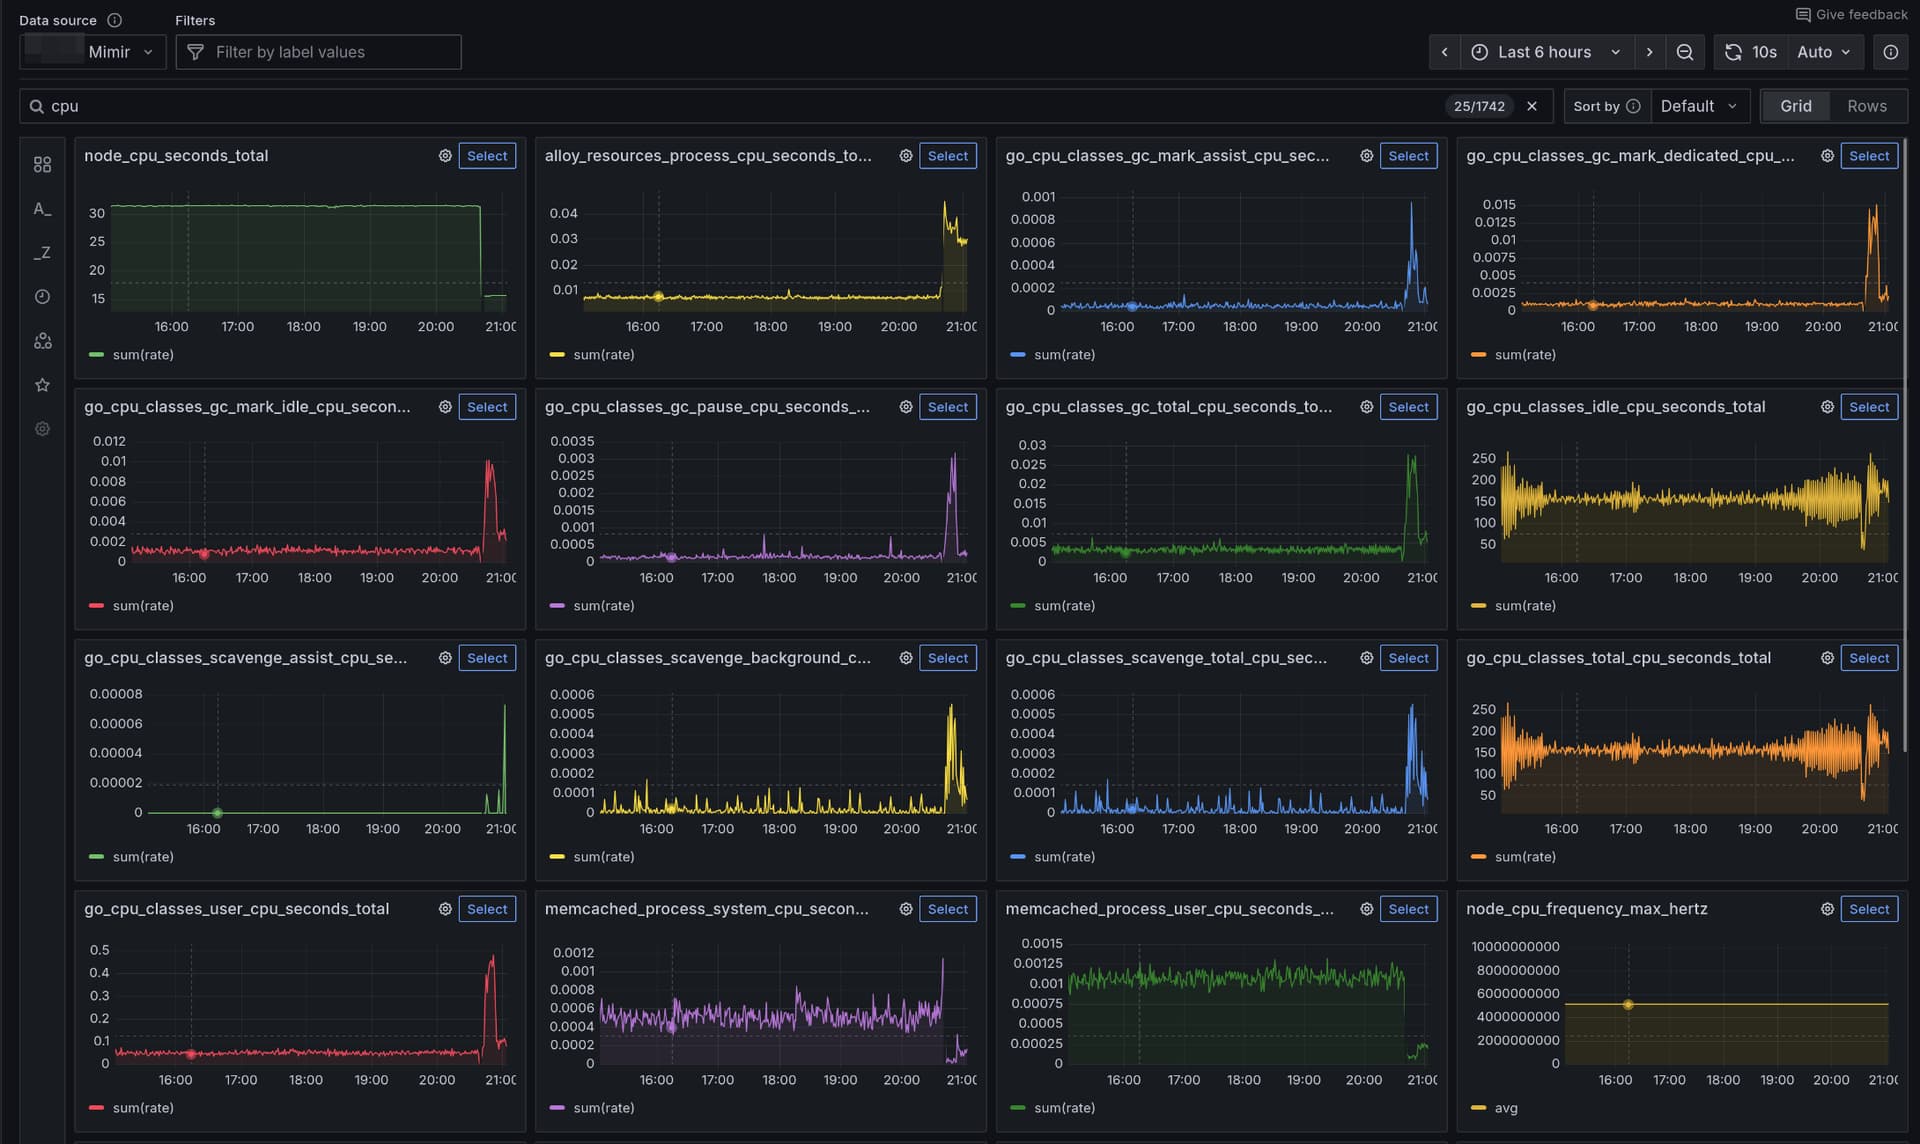
Last 6hrs:
Last 3hrs:

You can clearly see that the data for the last 3hrs is as available as for the last 6hrs.
Any ideas what the issue may be?