Hi all!
I’m using Grafana v5.3.1 on Windows Server 2012. I am able to pull my CloudWatch custom metrics in from AWS with my API key and everything looks great, except the Left Y axes. The default unit selected is “mebibytes” and will not change to anything else no matter how hard I try. Does anyone have any ideas on what I can do to get this to be in Megabytes?
There is a new Cloudwatch feature https://github.com/grafana/grafana/issues/13575. Are you publishing your custom metric with the right unit?
Hi there,
I believe it is. It is showing in MB in my CloudWatch Dashboard.
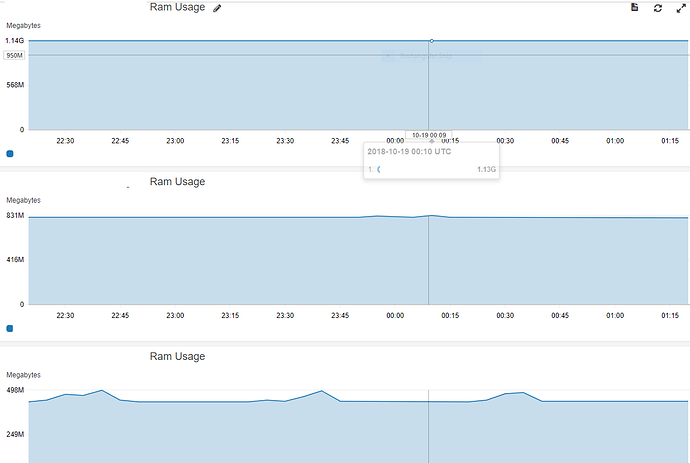
The first screenshot shows server 1, 2, and then 3.
The second screenshot shows the same metric in Grafana for Server 1.
IMHO it is a bug. Current implementation uses Grafana IEC (binary) units for decimals units returned by Cloudwatch. Feel free to open GitHub issue.
Feature request https://github.com/grafana/grafana/issues/13733 can be used as a workaround.

