Hi everyone,
I am currently using Grafana 10.0. I would like a graph that shows the extent to which a threshold value has been achieved. Any values less than the threshold value should progressively be assigned colors from red (furthest, either smaller or bigger depending on context, from the threshold) to a light shade of green (closest, either smaller or bigger depending on context, from the threshold); any values equal to or above the threshold value should progressively be assigned colors from light green to green.
This is what I have tried so far…
  visualMap: {
    min: 0,
    max: Math.max(...values),
    splitNumber: 10,
    inRange: {
      color: [
        'red',
        'yellow',
        'green'
      ],
    },
    outOfRange: {
      color: '#eee'
    },
    pieces: [
      {
        min: 0,
        max: 800000000,
        color: [
          'red',
          '#98FF98'
        ]
      },
      {
        min: 800000000,
        max: Math.max(...values),
        color: [
          '#98FF98',
          'green'
        ]
      }
    ],
What I expect is something similar to what I get without using pieces as shown below:

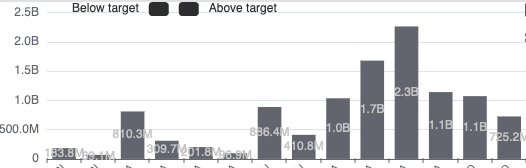
Instead I am getting this…
Any pointers on how to achieve this will be highly appreciated