I am provisioning new clusters via Terraform, each with an installation of Grafana (4.2) on one node, displaying monitoring statistics (held in Graphite and InfluxDB) from other nodes via Riemann, Collectd, and CAdvisor. Using Wizzy, I am importing a default dashboard with alerts on startup of the freshly installed Grafana.
I notice that immediately on startup, Grafana fires one empty notification, then quickly sends the OK.
Here’s the config and history of the Root disk usage alert:

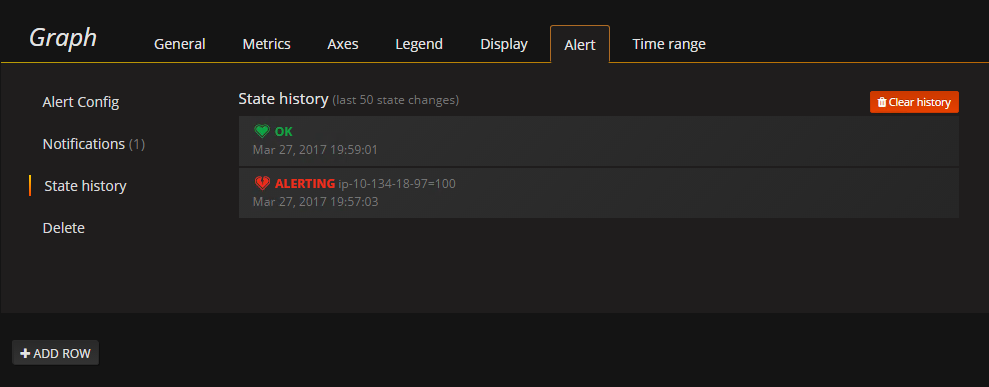
My hope is to avoid this empty notification to our Slack channel when a new cluster (and it’s Grafana) first comes online. What is the best way to achieve this?
Some ideas I’ve considered:
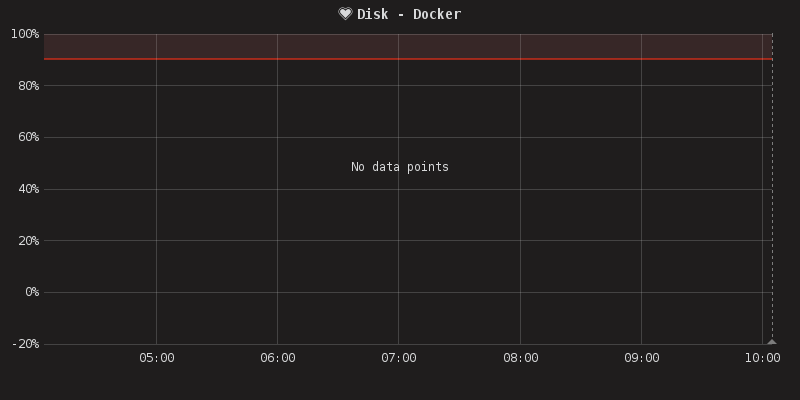
- Configuring Grafana to not fire an alert when a very short history (seconds) exist for a particular measure. The graph query is to average 15 minutes, but only a few seconds of data exists when this fires.
- Some deployment scripting to temporarily start Grafana with ‘execute_alerts’ set to false in grafana.ini, then after a # of minutes, change execute_alerts back to true and restart Grafana again, all via scripting.
- Other…
Any help on this would be most appreciated.
