Alloy pipeline to create and populate new labels from log message data

I’m migrating from promtail to alloy and trying to get the same output from alloy.

My promtail config.yaml has a pipeline stage that enriches the Loki telemetry with the process-id and sudo information. As I understand it, it pulls this information out of the log message (using regex) and assigns it to its own label.

See below:

# ..rest of file

scrape_configs:
  - job_name: system
    static_configs:
      - targets:
          - 127.0.0.1 #hidden for forum
        labels:
          job: syslogs
          host: ${HOSTNAME}
          dc: ${DC}
          __path__: /var/log/{syslog,auth.log}

    pipeline_stages:
      - match:
          selector: '{filename="/var/log/syslog"}'
          stages:
            - regex:
                expression: '(?P<procname>\S+?)(?P<pid>\[\d+\]:?)'
            - labels:
                procname:

      - match:
          selector: '{filename="/var/log/auth.log"}'
          stages:
            - regex:
                expression: '(?P<procname>\S+?)(?P<pid>\[\d+\]:?)'
            - labels:
                procname:

      - match:
          selector: '{filename="/var/log/auth.log"}'
          stages:
            - regex:
                expression: '(?P<sudo>sudo:?): .* ; COMMAND='
            - labels:
                sudo:

I tried to use the migration tool discussed in the migrate from protail docs and it generated the alloy blocks below. I do not think this will work as it seems to be populating the labels with null data which is not what promtail is doing

//rest of file

loki.process "system" {
        forward_to = [loki.write.default.receiver]

        stage.match {
                selector = "{filename=\"/var/log/syslog\"}"

                stage.regex {
                        expression = "(?P<procname>\\S+?)(?P<pid>\\[\\d+\\]:?)"
                }

                stage.labels {
                        values = {
                                procname = null,
                        }
                }
        }

        stage.match {
                selector = "{filename=\"/var/log/auth.log\"}"

                stage.regex {
                        expression = "(?P<sudo>sudo:?): .* ; COMMAND="
                }

                stage.labels {
                        values = {
                                sudo = null,
                        }
                }
        }
}

I tried to use a loki.relabel block in my own implementation, but that also didn’t work. See my implementation below:

//.. initial alloy blocks

loki.relabel "unix_log_files_syslog" {
    forward_to = [loki.relabel.unix_log_files_label_cleaner.receiver]
    rule {
        action        = "replace"
        regex         = "(?P<procname>\\S+?)(?P<pid>\\[\\d+\\]:?)"
        replacement   = "${procname}"
        target_label  = "procname"
    }
}

loki.relabel "unix_log_files_auth" {
    forward_to = [loki.relabel.unix_log_files_label_cleaner.receiver]
    rule {
        action        = "replace"
        regex         = "(?P<procname>\\S+?)(?P<pid>\\[\\d+\\]:?)"
        replacement   = "${procname}"
        target_label  = "procname"
    }
    rule {
        action       = "replace"
        regex        = "(?P<sudo>sudo:?): .* ; COMMAND="
        replacement  = "${sudo}"
        target_label = "sudo"
    }
}

//.. furture alloy code

What am I doing wrong? Please assist if possible :slight_smile:

Hi! I agree that setting to null looks somewhat suspicious. I would expect that it should be set to "" in order to preserve the same behaviour - this is based on reading the promtail docs and comparing to equivalent Alloy docs.

Can you try setting to "" instead of null and see if it works for you? If that resolves the problem, I think it could be a bug in the converter and we’d want to file this in GitHub.

If that doesn’t solve the problem, let us know what are the issues you’re observing and any error messages you get.

Have you actually tried to use the generated config? It actually looks ok to me.

The reason it uses null is to say that the target label is the same name as the parsed label. For example, all the following are essentially the same thing:

stage.labels {
   values = {
     procname = ,
   }
}
stage.labels {
   values = {
     procname = procname ,
   }
}
stage.labels {
   values = {
     procname = null,
   }
}

Hi! I’ve tried to configure alloy pipeline for logs exporting to cloud Loki but I still receiving an error: " error at least one label pair is required per stream".
This message occurs because no labels were sent to Loki (I can see it in alloy stdout).

Alloy stdout with log (proof that output contains desired fields that must be exported as labels):

ts=2024-07-15T03:34:04.499931625Z level=info component_path=/ component_id=loki.echo.containers receiver=loki.echo.containers entry="{\"time\":\"2024-07-15T03:34:00.419357591Z\",\"level\":\"INFO\",\"msg\":\"app started\",\"g_inf\":{\"service\":\"api\",\"env\":\"test\",\"instance\":\"api_gateway\"}}" labels={}

ts=2024-07-15T03:34:05.700193721Z level=error msg="final error sending batch" component_path=/ component_id=loki.write.grafana_cloud_loki component=client host=logs-prod-006.grafana.net status=400 tenant="" error="server returned HTTP status 400 Bad Request (400): error at least one label pair is required per stream"

Here is my pipeline:

discovery.docker "containers" {
  host = "unix:///var/run/docker.sock"
  filter {
      name      = "label"
      values    = ["service=api_gateway"]
  }
}

loki.source.docker "containers" {
  host       = "unix:///var/run/docker.sock"
  targets    = discovery.docker.containers.targets
  forward_to = [loki.process.containers.receiver]
}

loki.process "containers" {
	forward_to = [loki.write.grafana_cloud_loki.receiver, loki.echo.containers.receiver]

    stage.json {
        expressions = {
        	attrs  = "",
        	log    = "log",
        	stream = "stream",
        }
    }

	stage.timestamp {
		source = "time"
		format = "RFC3339Nano"
	}

	stage.json {
		expressions = {
			fn_name       = "",
			g_inf         = "",
			http_code     = "",
			level         = "",
			oai_run_id    = "",
			oai_thread_id = "",
			search_id     = "",
			u_id          = "",
		}
		source = "log"
	}

	stage.json {
		expressions = {
			env          = "",
			service_name = "service",
			instance     = "instance",
		}
		source = "g_inf"
	}

	stage.labels {
		values = {
			env            = null,
			service_name   = null,
			instance       = null,
			fn_name        = null,
			http_code      = null,
			level          = null,
			oai_run_id     = null,
			oai_thread_id  = null,
			search_id      = null,
			tag            = null,
			u_id           = null,
		}
	}

	stage.output {
		source = "log"
	}
}

loki.echo "containers" {}

loki.write "grafana_cloud_loki" {
  endpoint {
    url = "https://logs-prod-006.grafana.net/loki/api/v1/push"

    basic_auth {
      username = ""
      password =""
    }
  }
}

As you can see label stage was configured and I have these fields in log. For labels stage I’ve tried both “” and null but still labels not sending to Loki:(

  1. Can you provide an example log please?
  2. Try changing your labels stage to this:
  stage.labels {
    values = {
      env            = "",
      service_name   = "",
      instance       = "",
      fn_name        = "",
      http_code      = "",
      level          = "",
      oai_run_id     = "",
      oai_thread_id  = "",
      search_id      = "",
      tag            = "",
      u_id           = "",
    }
  }

here is log example that my service creates:
{"time":"2024-07-16T00:45:05.512998404Z","level":"INFO","msg":"app started","g_inf":{"service":"api","env":"prod","instance":"api_gateway"}}

I tried both null and “” values.
Should mention that originally I used CLI alloy tool to convert promtail config:

server:
  http_listen_port: 0
  grpc_listen_port: 0

positions:
  filename: /tmp/positions.yaml

clients:
  - url: url_deleted

scrape_configs:
  - job_name: system
    static_configs:
      - targets:
          - localhost
        labels:
          job: varlogs
          __path__: /var/log/*log

  - job_name: containers
    static_configs:
      - targets:
          - localhost
        labels:
          job: containerlogs
          __path__: /var/lib/docker/containers/*/*log

    pipeline_stages:
      # Docker logs
      - json:
          expressions:
            log: log
            stream: stream
            attrs:
      - timestamp:
          format: RFC3339Nano
          source: time
      # API Gateway logs
      - json:
          expressions:
            g_inf:
            level:
            u_id:
            http_code:
            fn_name:
            oai_thread_id:
            oai_run_id:
            search_id:
          source: log
      - json:
          expressions:
            service_name: service
            env:
          source: g_inf
      # Adding labels to index
      - labels:
          tag:
          container_name:
          service_name:
          env:
          level:
          u_id:
          http_code:
          fn_name:
          oai_thread_id:
          oai_run_id:
          search_id:
      - output:
          source: log

I changed log scraping stage after I noticed that Alloy don’t like logs format from other services.

Currently I’m using Promtail for log exporting because provided config works.

Well your log doesn’t match your json parse at all.

You are looking for g_inf under log, but your example log doesn’t contain the log key.

I’m sorry for confusing you. As you can see I scrape docker container logs.

So if I cat docker log file the log format is

root@2220735-cn21066:~# cat /var/lib/docker/containers/682c9c324421fd6b88cc6d453c014630b20e1e9aed50130d2cd1eaceeea2f021/682c9c324421fd6b88cc6d453c014630b20e1e9aed50130d2cd1eaceeea2f021-json.log

{
  "log": "{\"time\":\"2024-07-15T20:44:20.930443243Z\",\"level\":\"INFO\",\"msg\":\"app started\",\"g_inf\":{\"service\":\"api\",\"env\":\"prod\",\"instance\":\"api_gateway\"}}\n",
  "stream": "stdout",
  "time": "2024-07-15T20:44:20.930608403Z"
}

Previously I’ve provided service log format

I tested your log and it looks ok to me. The only difference is I am sourcing from a local file instead of docker.

Test log I used (/tmp/test.log):

{"log": "{\"time\":\"2024-07-15T20:44:20.930443243Z\",\"level\":\"INFO\",\"msg\":\"app started\",\"g_inf\":{\"service\":\"api\",\"env\":\"prod\",\"instance\":\"api_gateway\"}}\n","stream": "stdout","time": "2024-07-15T20:44:20.930608403Z"}

Config:

local.file_match "test" {
  path_targets = [{"__path__" = "/tmp/test.log"}]
}

loki.source.file "test" {
  targets    = local.file_match.test.targets
  forward_to = [loki.process.containers.receiver]
}

loki.process "containers" {
    forward_to = [loki.echo.containers.receiver]

    stage.json {
        expressions = {
            attrs  = "",
            log    = "log",
            stream = "stream",
        }
    }

    stage.timestamp {
        source = "time"
        format = "RFC3339Nano"
    }

    stage.json {
        expressions = {
            fn_name       = "",
            g_inf         = "",
            http_code     = "",
            level         = "",
            oai_run_id    = "",
            oai_thread_id = "",
            search_id     = "",
            u_id          = "",
        }
        source = "log"
    }

    stage.json {
        expressions = {
            env          = "",
            service_name = "service",
            instance     = "instance",
        }
        source = "g_inf"
    }

    stage.labels {
        values = {
            env            = null,
            service_name   = null,
            instance       = null,
            fn_name        = null,
            http_code      = null,
            level          = null,
            oai_run_id     = null,
            oai_thread_id  = null,
            search_id      = null,
            tag            = null,
            u_id           = null,
        }
    }

    stage.output {
        source = "log"
    }
}

loki.echo "containers" {}

loki.write "grafana_cloud_loki" {
  endpoint {
    url = "https://logs-prod-006.grafana.net/loki/api/v1/push"

    basic_auth {
      username = ""
      password =""
    }
  }
}

Echo output fro Alloy:

Jul 19 11:25:23 node0 alloy[64237]: ts=2024-07-19T17:25:23.895292015Z level=info component_path=/ component_id=loki.echo.containers receiver=loki.echo.containers entry="{\"time\":\"2024-07-15T20:44:20.930443243Z\",\"level\":\"INFO\",\"msg\":\"app started\",\"g_inf\":{\"service\":\"api\",\"env\":\"prod\",\"instance\":\"api_gateway\"}}\n" labels="{env=\"prod\", filename=\"/tmp/test.log\", instance=\"api_gateway\", level=\"INFO\", service_name=\"api\"}"

I would say try to double check alloy journal logs, verify each block of code is working (maybe send log straight to echo without processing just to confirm what it looks like).

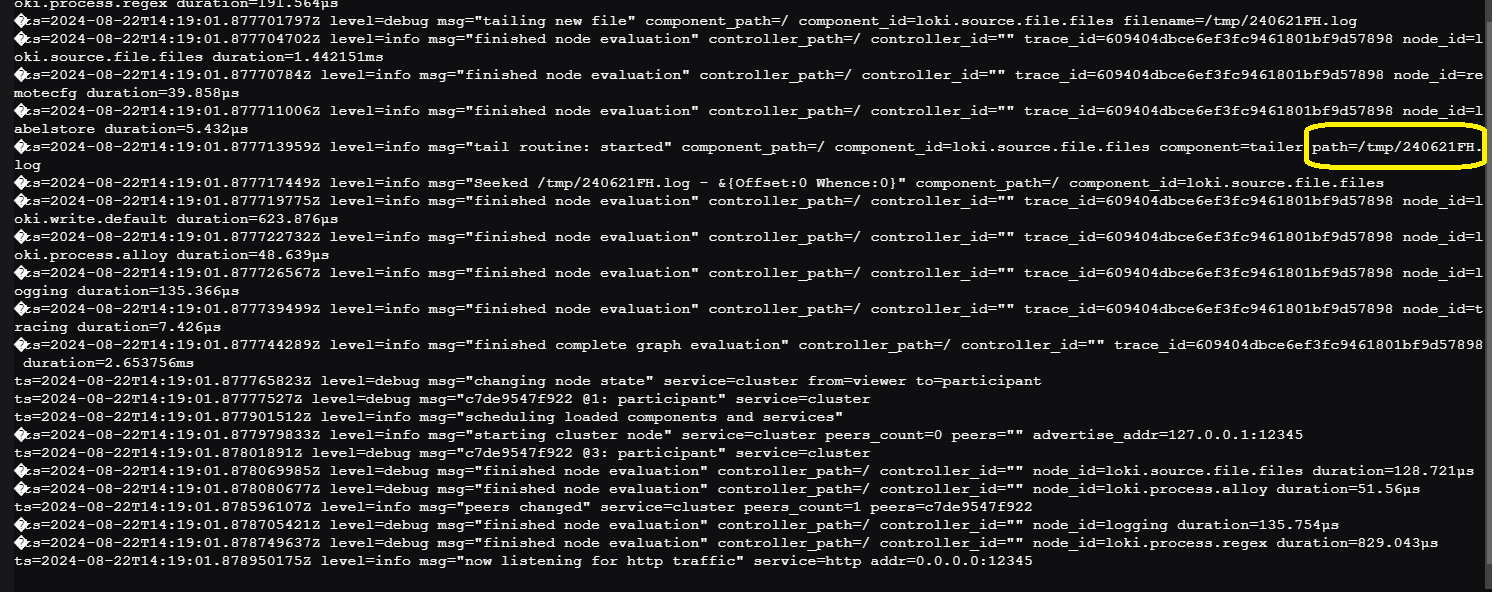
I am trying to vet out my stage.regex using this config.alloy

loki.source.file "files" {
  targets    = [
    {__path__ = "/tmp/240621FH.log", "color" = "pink"},
  ]
  forward_to = [loki.process.regex.receiver]
}

loki.process "regex" {
    stage.regex {
        expression = "(?P<zoom><\\d+>\\d)(\\s*)(?P<date>.*T)(?P<time>.*Z)(\\s*)(-.)*(?P<trace>\\w+\\d+).(-\\s*)(?P<time2>(\\d+:\\d+:\\d+.\\d+))(\\s*)(?P<msgid>.*:)(?P<hex>.*)"
    }
    forward_to = [loki.echo.debug.receiver]
}

loki.echo "debug" { }

I am not seeing anything in my alloy container

Any idea what I might be missing, been at this for 2nd day

Did you reset the alloy state file? Can you provide some example log? I can try it and see.

1 Like

I am restarting my container each time I make changes to my config.alloy as I am in learning stage podman-compose up -d --force-recreate

sorry Tony, cant share the log file, but it is syslog RFC 5424

here is an obfuscated sample

<00>1 2024-06-21T19:37:22.293Z - - - TONY22 - 19:37:22.292 ini mini mo: kaplow

vetted the regex using Loki in grafana and it looks good

This worked for me:

Config:

loki.source.file "files" {
  targets    = [
    {__path__ = "/tmp/240621FH.log", "color" = "pink"},
  ]
  forward_to = [loki.process.regex.receiver]
}

loki.process "regex" {
    stage.regex {
        expression = `(?P<zoom><\d+>\d)\s*(?P<date>.*T)(?P<time>.*Z)\s*(-.)*(?P<trace>\w+\d+).(-\s*)(?P<time2>\d+:\d+:\d+.\d+)\s*(?P<msgid>.*:)\s+(?P<hex>.*)`
    }
    forward_to = [loki.echo.debug.receiver]

    stage.labels {
      values = {
        zoom = "",
        trace = "",
        msgid = "",
        hex = "",
      }
    }
}

loki.echo "debug" { }

Docker command:

podman run \
  -v /root/alloy/config.alloy:/etc/alloy/config.alloy \
  -v /root/alloy/test.log:/tmp/240621FH.log \
  -p 12345:12345 \
  grafana/alloy:latest \
    run --server.http.listen-addr=0.0.0.0:12345 --storage.path=/var/lib/alloy/data \
    /etc/alloy/config.alloy

Logs:

ts=2024-08-22T21:50:30.179410066Z level=info msg="running usage stats reporter"
ts=2024-08-22T21:50:30.180074893Z level=info msg="Seeked /tmp/240621FH.log - &{Offset:0 Whence:0}" component_path=/ component_id=loki.source.file.files
ts=2024-08-22T21:50:30.180682939Z level=info msg="tail routine: started" component_path=/ component_id=loki.source.file.files component=tailer path=/tmp/240621FH.log
ts=2024-08-22T21:50:30.181706987Z level=info msg="starting cluster node" service=cluster peers_count=0 peers="" advertise_addr=127.0.0.1:12345
ts=2024-08-22T21:50:30.182485115Z level=info msg="peers changed" service=cluster peers_count=1 peers=532c3b36a1dc
ts=2024-08-22T21:50:30.183555747Z level=info msg="now listening for http traffic" service=http addr=0.0.0.0:12345
ts=2024-08-22T21:50:30.184484988Z level=info component_path=/ component_id=loki.echo.debug receiver=loki.echo.debug entry="<00>1 2024-06-21T19:37:22.293Z - - - TONY22 - 19:37:22.292 ini mini mo: kaplow" labels="{color=\"pink\", filename=\"/tmp/240621FH.log\", hex=\"kaplow\", msgid=\"ini mini mo:\", trace=\"TONY22\", zoom=\"<00>1\"}"

1 Like

i was missing this above

thanks as always!!! @tonyswumac