I have a dashboard that queries a graphite db and pulls data once a day, the data has the range of 0-1.0 (i.e. 0.997, 0.9998, and so forth), I am trying to set an alert for when those values fall below a threshold.
The below is what the graph looks like:
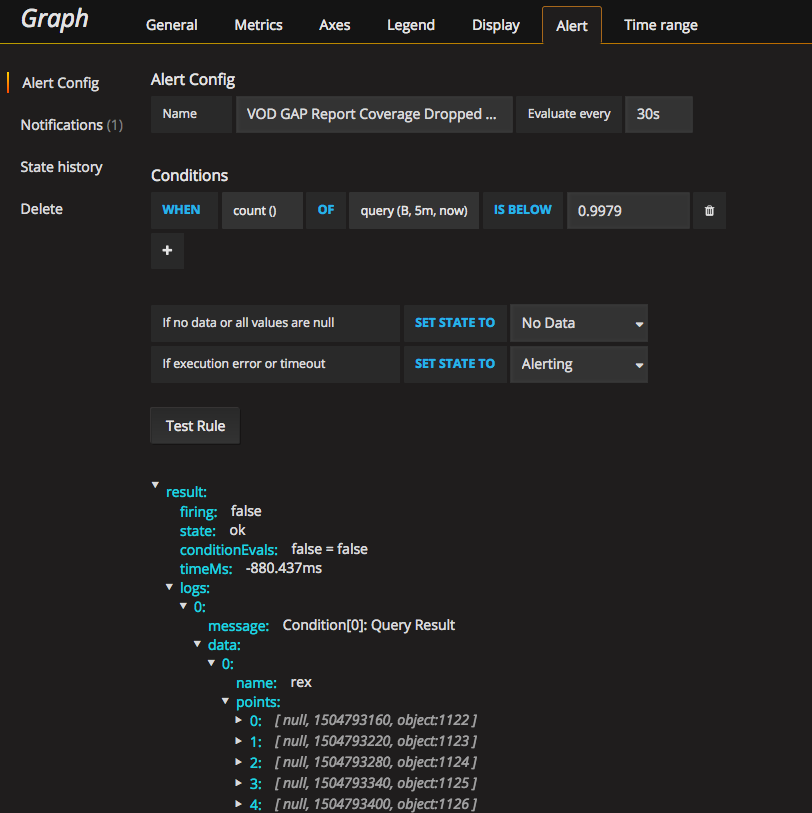
Clearly, one can see that data is being returned, however, in the alert section, the query returns null values that I cannot evaluate.
From the above one can see all the points have a value of null (not true based on the previous image)
I have tried every function available, they all return null, except for count, which returns the number of points (5, which is not helpful for my purpose). Any idea why this might be happening?
Did you resolve this? Guessing it is because there is not much data in the last 5 minutes. If you change the timepicker to be last 5 minutes, are you getting any data?
You can change alert condition to not look at the last 5m - either increase it to a longer period, like 15m or shift the 5m like this with now-5m:

The above condition looks at from 25 minutes ago to 5 minutes ago.
Hi Danielle,
Yes, I did resolve it, and your assumption is correct, the data is written to the DB once a day, so indeed, the last 5 minutes had no data to show, I changed the time filter to be (25h,now) and that seems to work. The alert fires whenever the threshold is met.
Thanks for your response!
Regards,
Cesar