hi there,
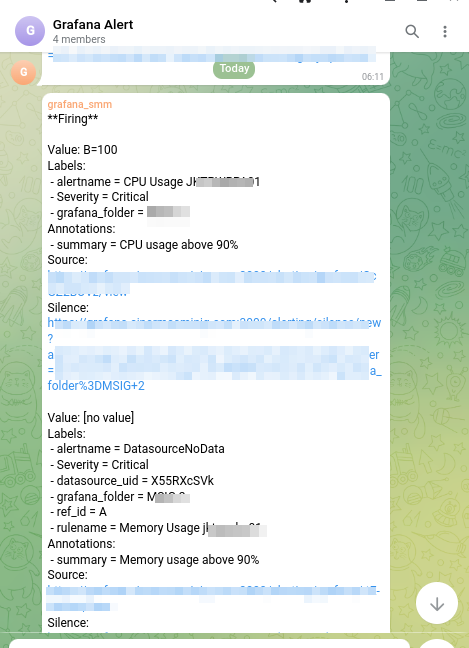
i have upgrade grafana version to v9.3.1, why i got many alert with alert no value
Hi! These are DatasourceNoData alerts, and happen when Grafana queries the datasource but there is no data for the time range. If this happens often then you will want to either increase the frequency that data is collected in your datasource, or increase the time range of the query.
Hi @georgerobinson how long is the ideal time (time range), especially for the windows server that I monitor?
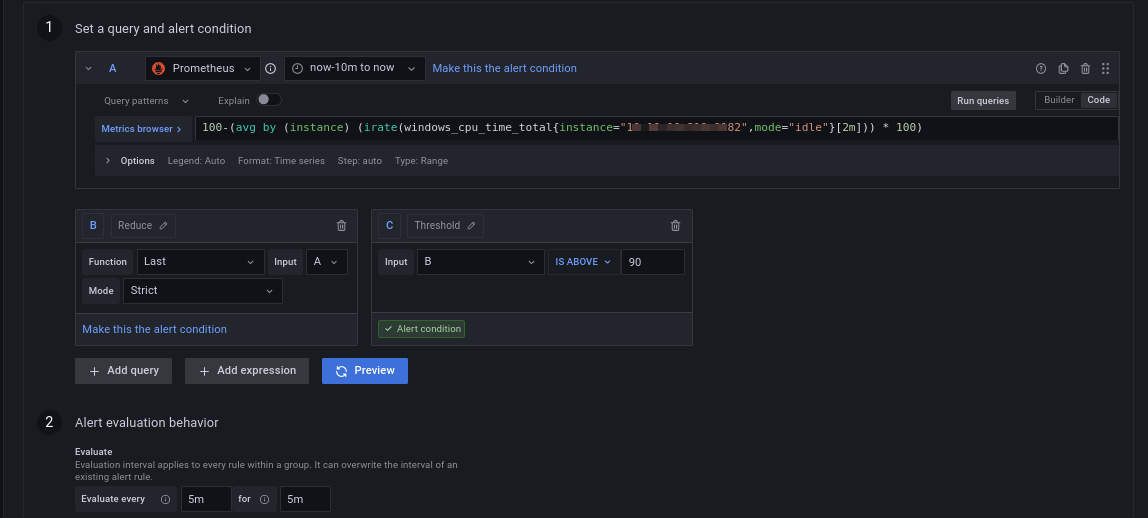
How often does the datasource collect data from these servers? In Prometheus, for example, the default scrape interval is 15 seconds.
i set like this, but still got many alert no value
Is there any suggestion so that I don’t get the no value alert?
Hi! Did you see my previous reply? If you know the answer to this it will help us fix your No Data issue.
How often does the datasource collect data from these servers?
yes i have tried it, but still getting novalue alert
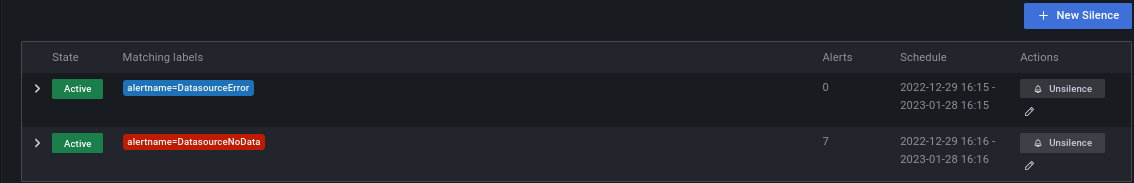
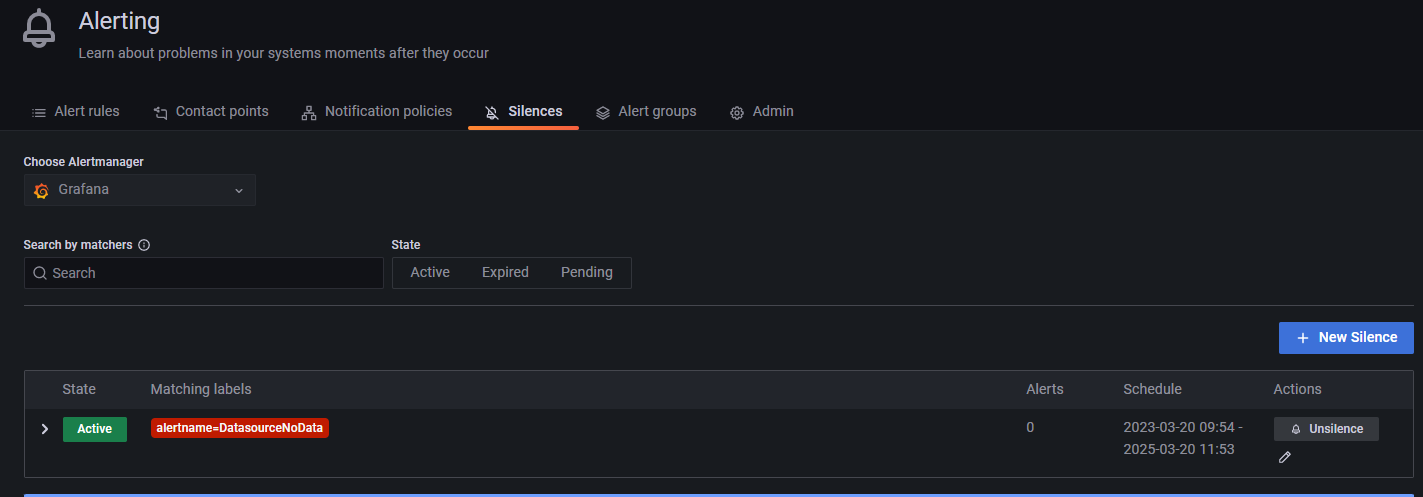
anyway, this case resolved with silences
Silence generally stops sending alert at all. Do you receive any alerts from crossing thresholds?
I silence based on the label alarmname=DatasourceNodata
so I still receive alerts when servers cross the threshold
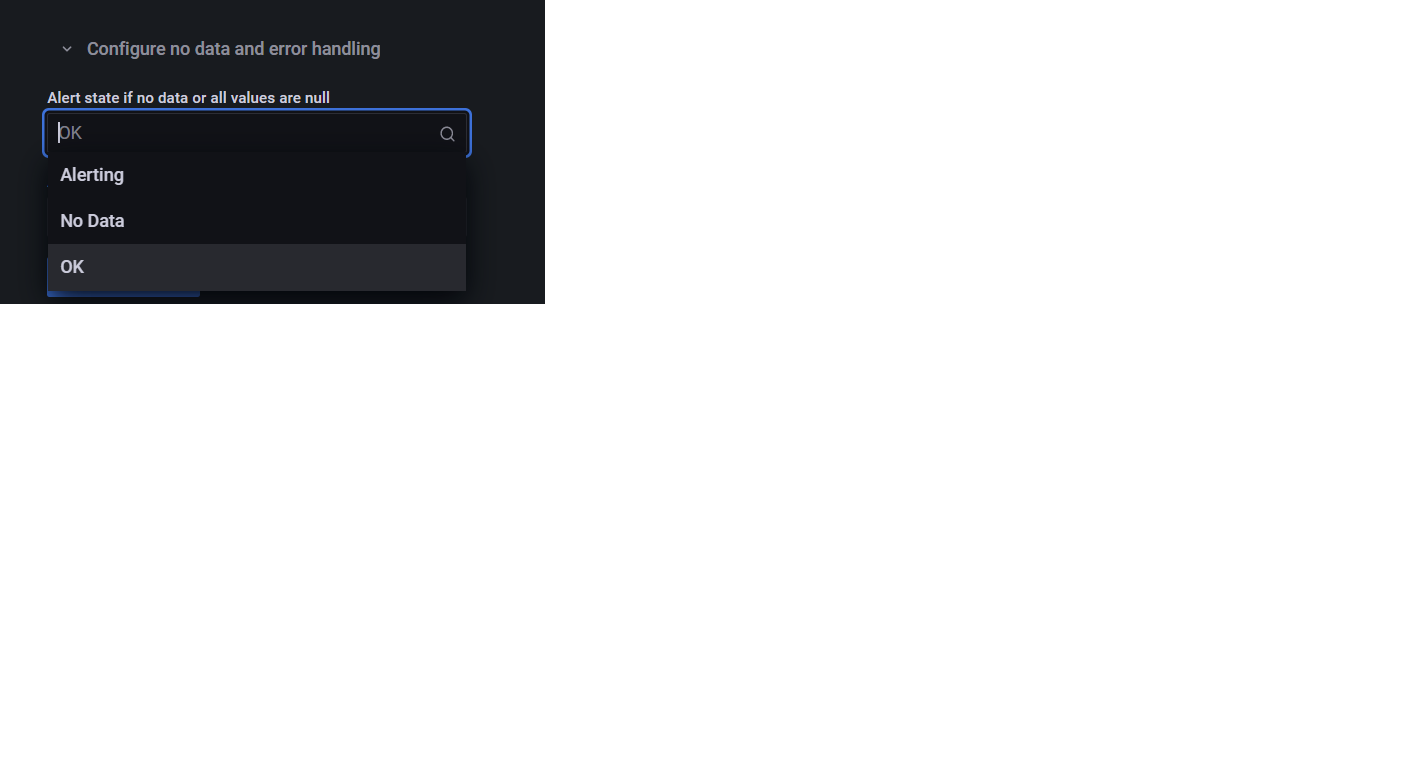
Hi @georgerobinson - I too am getting this alarm, my scrape value is set to 60s. I would like to know how to use “Configure no data and error handling” to silence these alarms the proper way but my pull down options are in the attached image. Not seeing an option for “Keep Last State” Thanks in advance.!