What Grafana version and what operating system are you using?
v8.5.13
Are you using Grafana Cloud or self-hosted Grafana?
Self Hosted
Are you using legacy alerting or Unified Alerting?
Unified Alerting
Was the alert in question migrated from the legacy platform into Unified Alerting, or did you first create it inside the new platform?
Create on new platform
Please list ALL configuration options related to alerting. You can find these in the Alerting and Unified Alerting sections of Grafana’s config file. If you are now using or have previously used the beta version of ngalert (released with Grafana 8), please note that too.
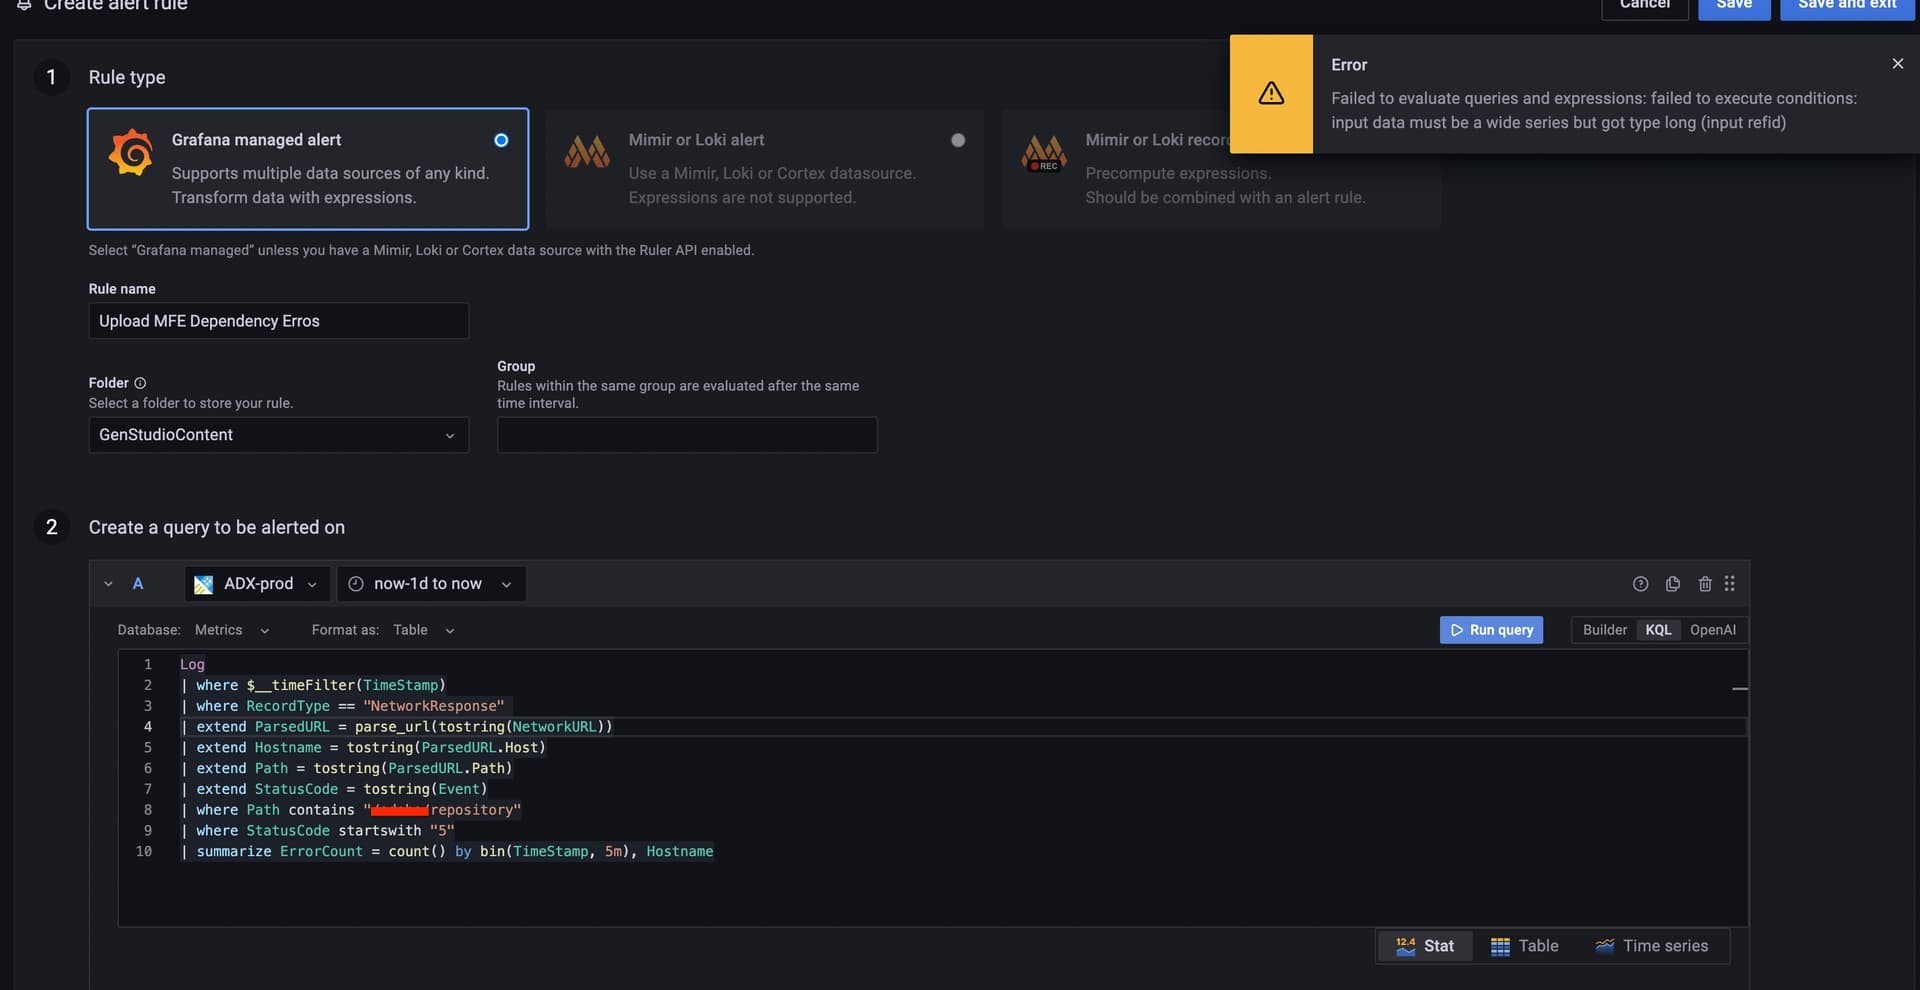
Rule type : Grafana Managed ALERT
KQL query created to alert
Type of query : Time series
Query:
Log
| where $__timeFilter(TimeStamp)
| where RecordType == “NetworkResponse”
| extend ParsedURL = parse_url(tostring(NetworkURL))
| extend Hostname = tostring(ParsedURL.Host)
| extend Path = tostring(ParsedURL.Path)
| extend StatusCode = tostring(Event)
| where Path contains “/identifier/repository”
| where StatusCode startswith “5”
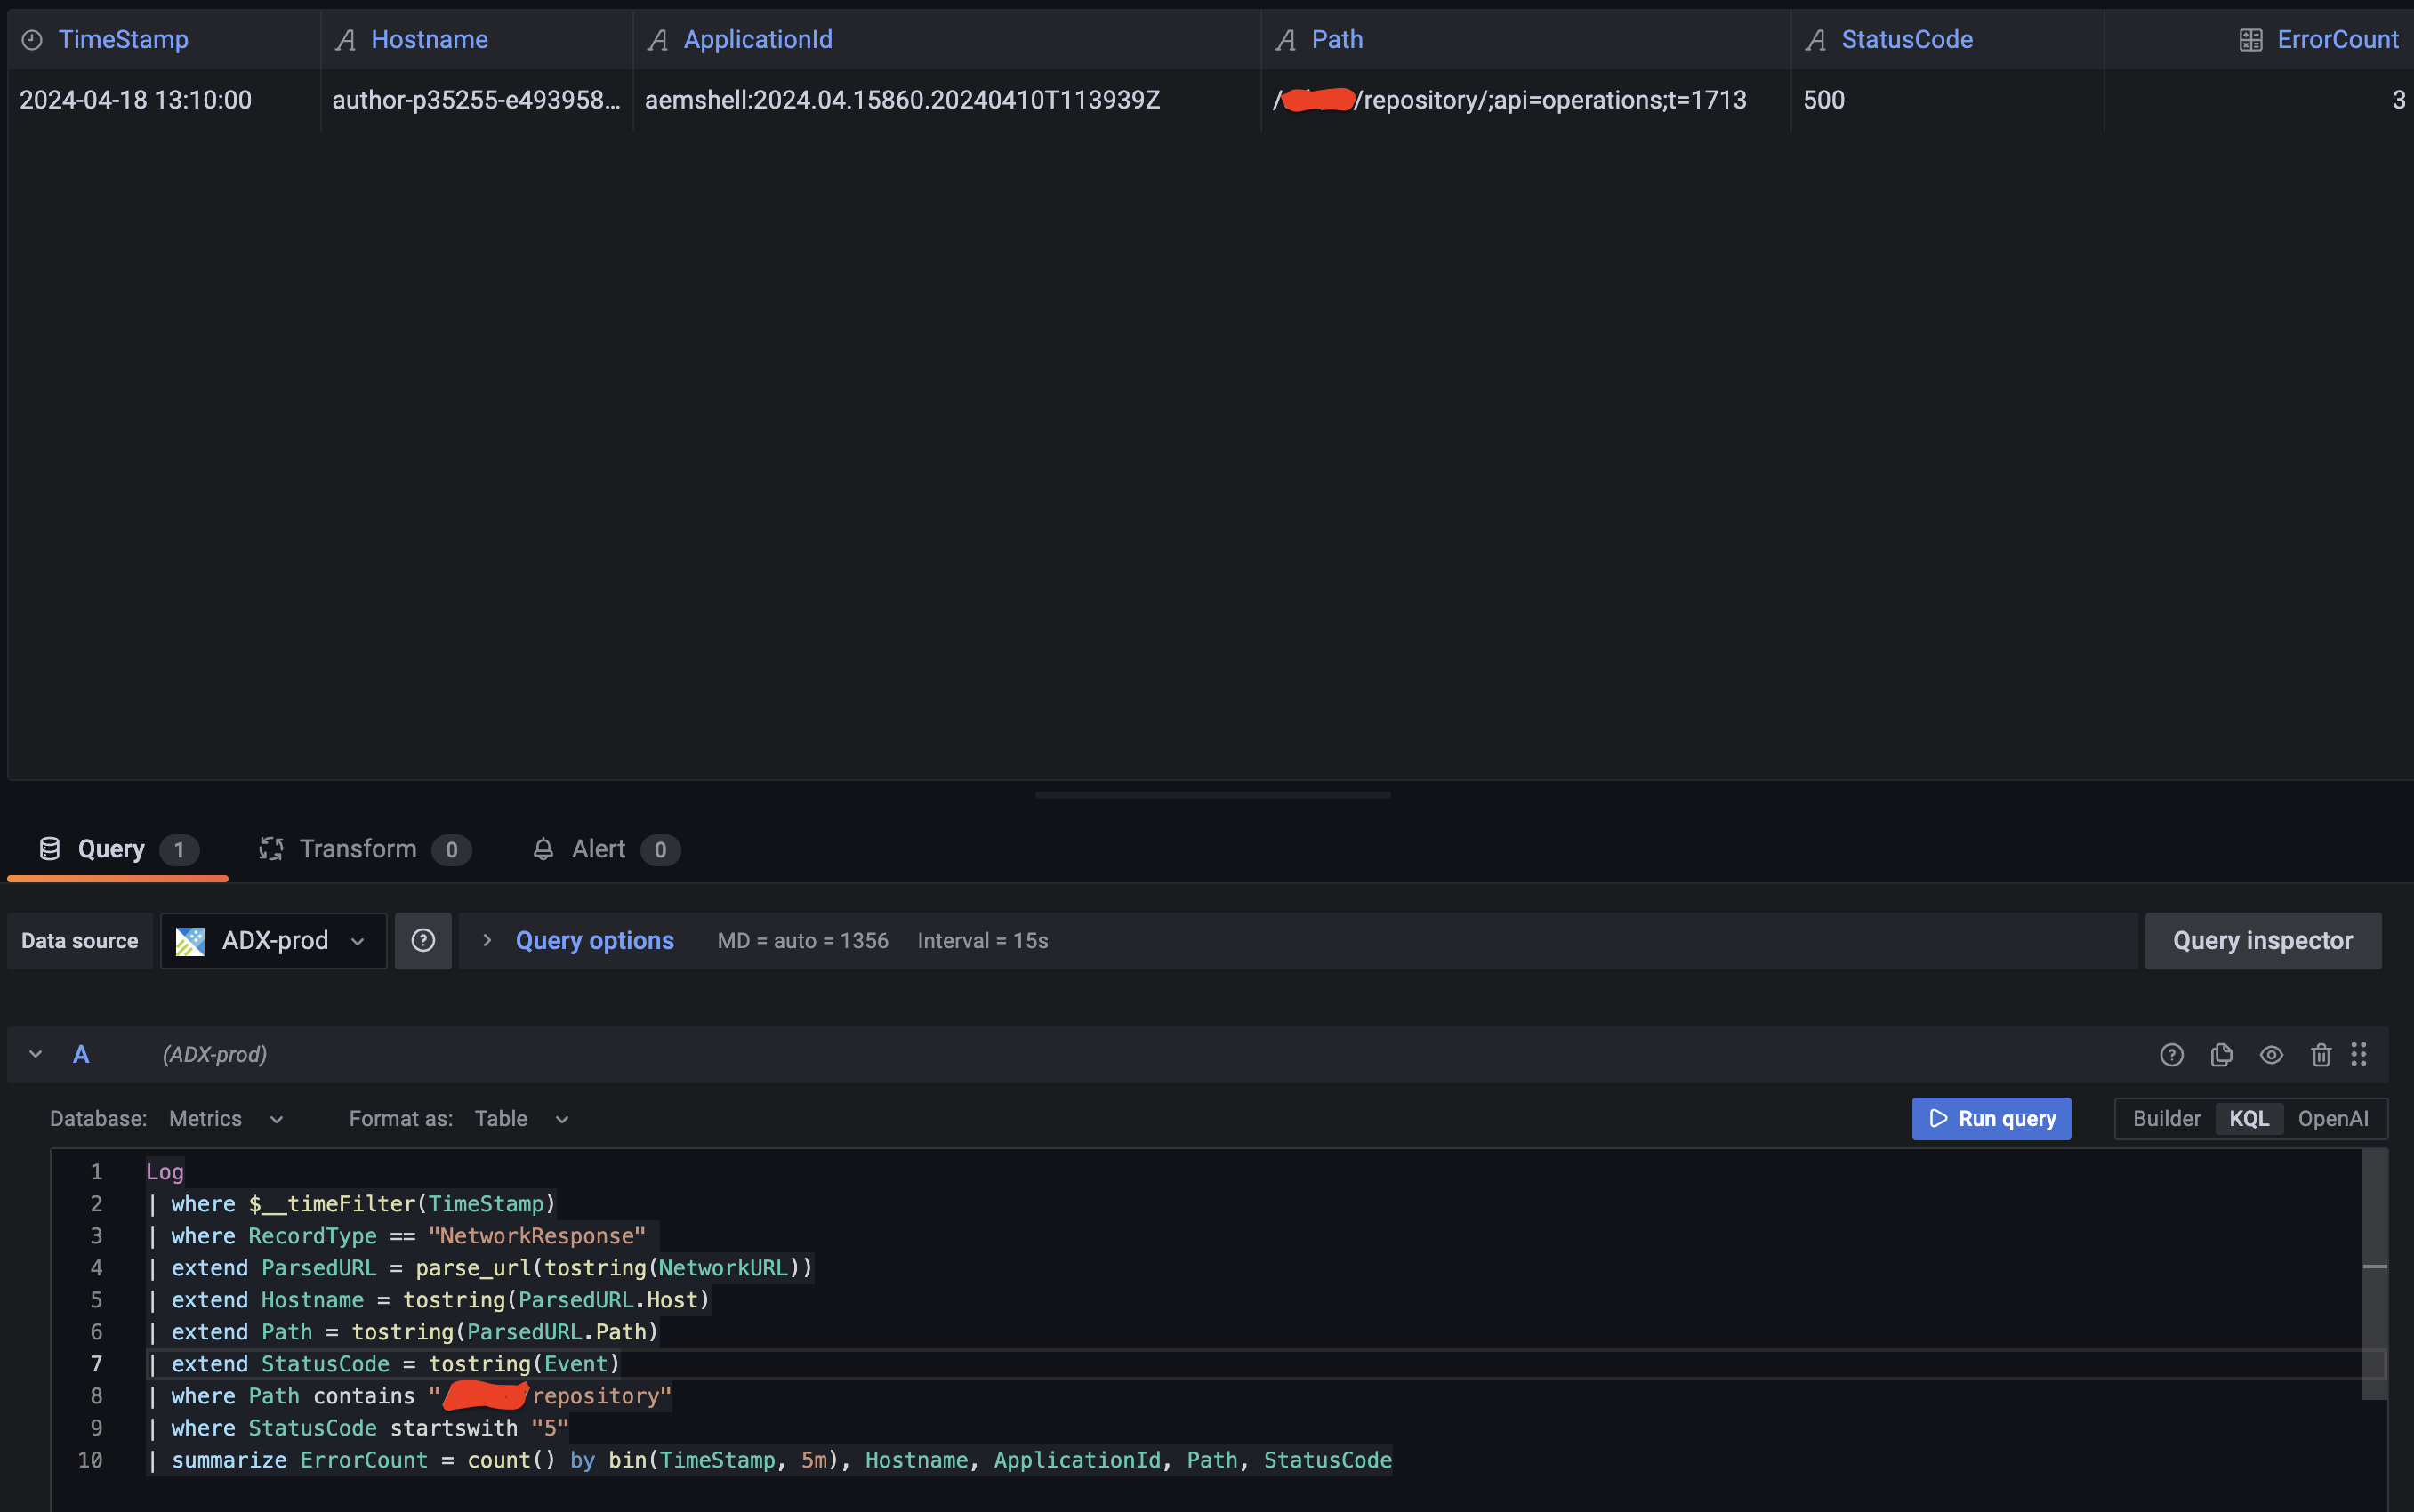
| summarize ErrorCount = count() by bin(TimeStamp, 5m), Hostname, applicationID, path
What are you trying to achieve?
Alert based on 5XX errors count returned and categorize them by hostname, applicationID, path to be used as labels when alerting
How are you trying to achieve it?
Configuring a kql based alert on Azure Data explorer database.
What happened?
Query returns the necessary columns(hostname, applicationID, path) with respective error count when i execute the same in a dashboard panel but fails when i use the same as alert query with error
"Failed to evaluate queries and expressions: failed to execute conditions: input data must be a wide series but got type long (input refid)"
What did you expect to happen?
The data that is returned is similar to what is mentioned in the documentation, however the alert query still fails.
Query result in alert panel

Query result in dashboard panel
Did you receive any errors in the Grafana UI or in related logs? If so, please tell us exactly what they were.
Failed to evaluate queries and expressions: failed to execute conditions: input data must be a wide series but got type long (input refid)