I am quite new to Grafana, and we are trying to monitor executors’ metrics on tens of instances for each cluster. And we want to alert if the monitored metric of any of the executors’ is above certain threshold.
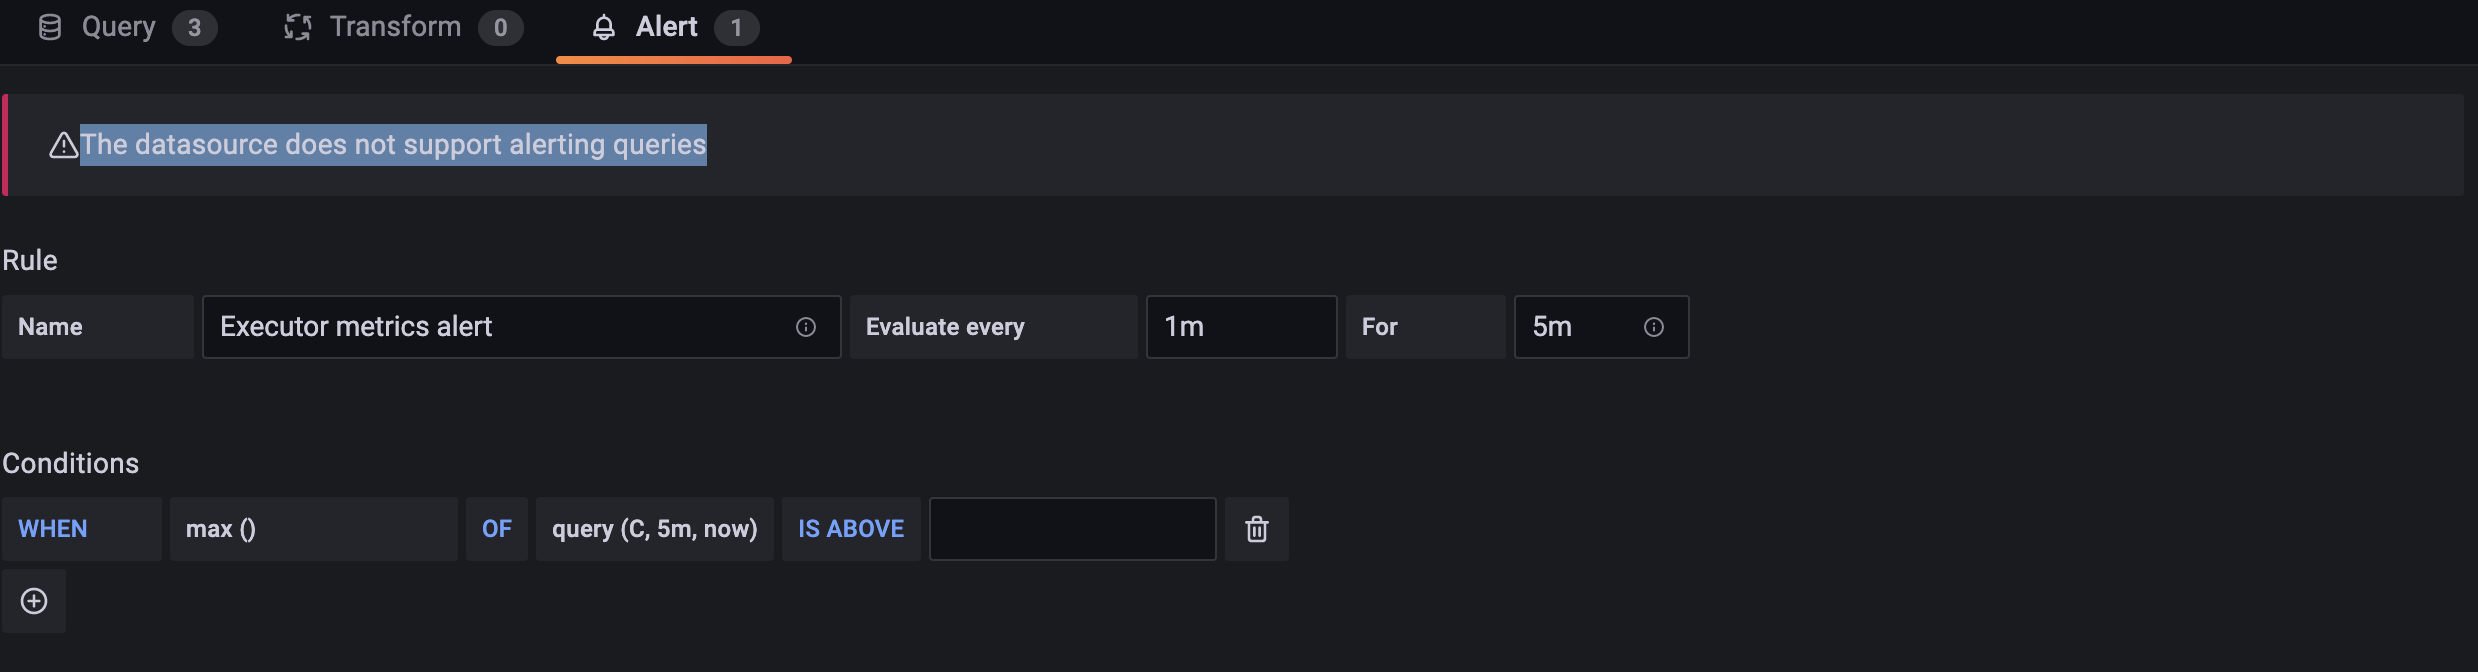
I could only see option of alerting upon using an aggregate function like min, max, avg, but what I am looking for is something like any(). I thought a query like
“max by (cluster_id, instance_id, executor_id) (executor_metrics)” in the panel would work, but even then in the alert tab, I need to specify the aggregate function. Can you please help if there is a direct way or some possible hacks to achieve this?
Since there could be hundreds of values to monitor for an alert, is there an efficient way to handle this scenario?
Welcome @rakeshvarma481 to the Grafana forum. It sounds like you are using Prometheus and could use Grafana’s multidimensional alerting. Have you read/watched this?
Thank you very much @grant2 for your answer. Looks like this is exactly what we are looking for. But is this multidimensional alerting only possible with Grafana version v9? We are using Grafana version v8.4.
However I see that, I could create reduce expression similar to the instructions from the link you shared,
I think multi-dimensional alerts were there in v8, but they became the default in v9. Can you go ahead and upgrade to v9? Once you do, you should see this on the left:
@grant2 Unfortunately not. At the moment we are using Amazon Managed Grafana and they are still on version v8.4 at the moment. If you can point me to some documentation/article how this is possible on v8.4 or lesser, that would be of great help.
Or we have to think of switching to custom installation of Grafana on some instance may be.