We’re using blackbox exporter for some endpoint monitoring and when creating an alert the json that is created doesn’t place quotes around the label values. This results in message templates that don’t show the values for the instance or other labels.
e.g. {{ .labels.instance }} site is DOWN
I’ve tried with both .Labels and .labels, doesn’t matter.
The data as output in the query and expressions is how I expect it to be.

The previewed alert values seem fine, until I take a look at Info
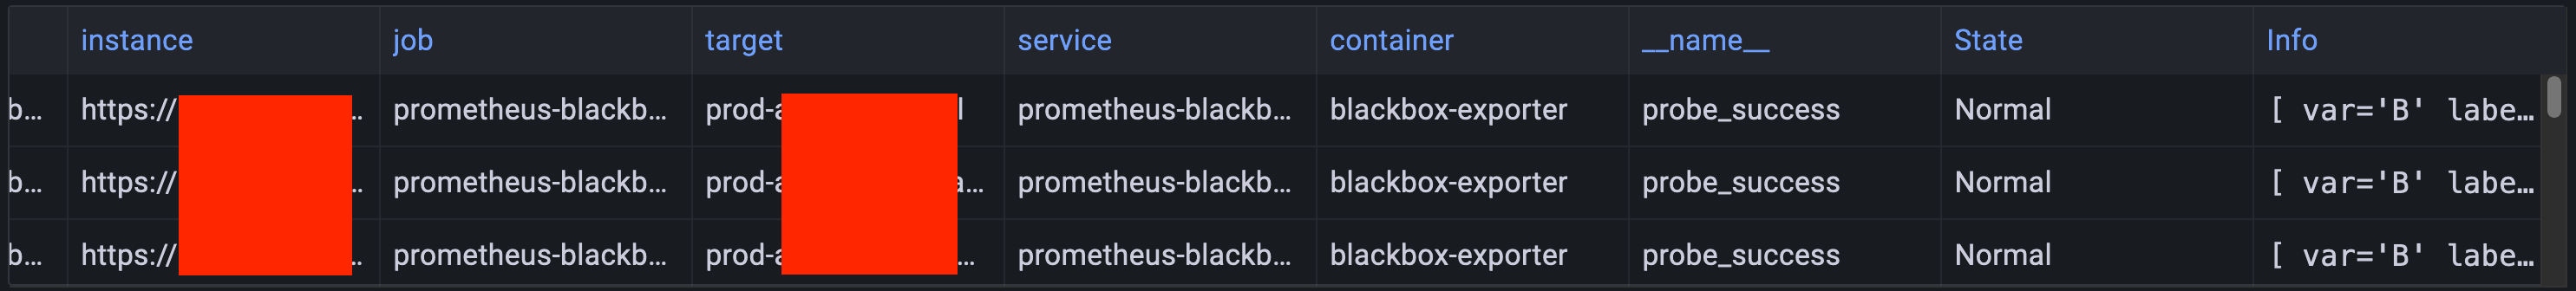
What Info looks like:
[ var='B' labels={__name__=probe_success, container=blackbox-exporter, endpoint=http, instance=https://removed.com/health, job=prometheus-blackbox-exporter, namespace=blackbox, pod=prometheus-blackbox-exporter-5cdf9d69df-bxktw, service=prometheus-blackbox-exporter, target=removed-api-internal} value=1 ], [ var='C' labels={__name__=probe_success, container=blackbox-exporter, endpoint=http, instance=https://removed.com/health, job=prometheus-blackbox-exporter, namespace=blackbox, pod=prometheus-blackbox-exporter-5cdf9d69df-bxktw, service=prometheus-blackbox-exporter, target=removed-api-internal} value=0 ]
What I believe should be happening:
[ var='B' labels={__name__="probe_success", container="blackbox-exporter", endpoint="http", instance="https://removed.com/health", job="prometheus-blackbox-exporter", namespace="blackbox", pod="prometheus-blackbox-exporter-5cdf9d69df-bxktw", service="prometheus-blackbox-exporter", target="removed-api-internal"
    } value=1
],
[ var='C' labels={__name__="probe_success", container="blackbox-exporter", endpoint="http", instance="https://removed.com/health", job="prometheus-blackbox-exporter", namespace="blackbox", pod="prometheus-blackbox-exporter-5cdf9d69df-bxktw", service="prometheus-blackbox-exporter", target="removed-api-internal"
    } value=0
]
I’m not sure whether quotes around the instance are really the issue, but unless I am mistaken it appears to be breaking the JSON data due to the colon.
This was not an issue with Alertmanager/Prometheus rules, but we are moving away from Alertmanager to get native support for MS teams alerts and we’d like to centralize our rules.
Currently on Grafana 9.0.5.