Hi I’m using alert list in dashboard for monitor the error and no data issue but it have something work not right with no data.
My expect is if I tick to no data in alert list it should be show all no data alert.
Version Grafana: 9.3.2
This is screenshot when i tick to no data and not tick to normal
This is screenshot when i tick to no data and normal
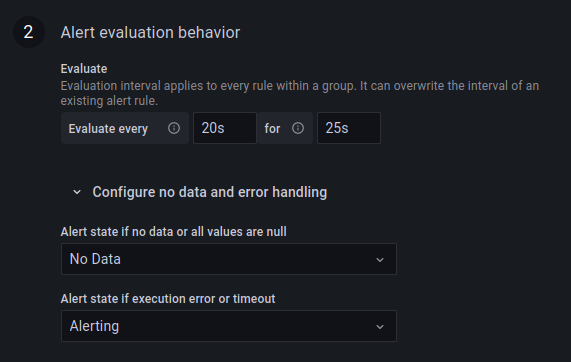
My setting for no data
This is definitely a bug, or rather a peculiar inconsistency in how we handle alert rules states and alert instance states.
I’ve taken the liberty to investigate a bit further and have arrived at a PR that will correctly filter rules / instances when either NoData or Error states are being applied to the alert list panel.
grafana:main ← grafana:alerting/alert-list-panel-fix
opened 01:29PM - 11 Jan 23 UTC
After some investigation prompted by [our community forum](https://community.gra… fana.com/t/alert-list-doesnt-work-right/79418/1) it turns out we're applying some incorrect filtering for `NoData` and `Error` states in the alert list panel.
We were previously applying a first pass filter on the state of the alert rule before proceeding to filter the alert list instances.
However, the `NoData` and `Error` states are exclusive to alert instances and the alert rule state does not reflect the states of these instances.
This means we have to skip the first filter pass when any of these filters are enabled and only filter the instances for each alert rule. Alert rules with no matching instances will be filtered out of the view anyway.
<img width="1067" alt="image" src="https://user-images.githubusercontent.com/868844/211818014-89a6f072-d5a8-44f1-ade9-04b5ba1abf0f.png">
## Additional changes
This PR also fixes the labels not being fetched if any data source fails to be contacted by checking if all promises have settled rather than being fulfilled.
2 Likes


