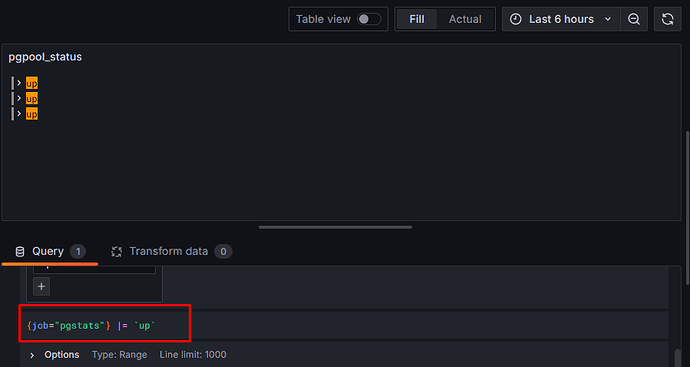
I’ve configured a Patroni cluster, with PGPool serving as the load balancer. We have a file that logs PGPool status in the following format:
Example 1:
up
up
up

Example 2:
up
down
up
I’m able to monitor PGPool status on a Grafana panel using the query:
{job="pgstats"} |= `up`
However, when attempting to use the same query on the Grafana alert page, I encounter the following error:
[sse.readDataError] [A] got error: input data must be a wide series but got type long (input refid)
Running the identical query on a Grafana dashboard panel yields the expected output, but it doesn’t function correctly on the alert page.
Versions:
- Grafana: v10.4.0
- Loki/Promtail: v2.9.0
- Alert Manager: v0.27.0
