i replaced my old panel-based alerts with the new alerts. so i created alert rules which contain annotations with a Dashboard UID and a Panel ID. this also works, so i can seee the green/red heart symbol in the dashboard panel if this alert fires.
but there is no annotation for start/end as with the old alerts (red/green annotation line). i opened the sqlite database to query the database and there is an entry in the annotations which has the alert id, but the columns for dashboard-id (id, not uid) and the panel-id are both 0.
is there anything i can do, so that the unified alerting system creates an annotation which is shown in a specific dashboard/panel?
i also have a problem with the the alert-system: it looks like that the alert-id’s were re-used. but i think this is a bug, so i created a ticket (Wrong alert state history · Issue #59813 · grafana/grafana · GitHub). only wanted to mention, perhaps there is a correlation (also i don’t think so).
i replaced my old panel-based alerts with the new alerts. so i created alert rules which contain annotations with a Dashboard UID and a Panel ID. this also works, so i can seee the green/red heart symbol in the dashboard panel if this alert fires.
but there is no annotation for start/end as with the old alerts (red/green annotation line). i opened the sqlite database to query the database and there is an entry in the annotations which has the alert id, but the columns for dashboard-id (id, not uid) and the panel-id are both 0.
is there anything i can do, so that the unified alerting system creates an annotation which is shown in a specific dashboard/panel?
is there any news on this topic, we have exactly the same problem. We use the latest Grafana version 9.3.1
The annotations is now showing in the normal panels, but I still have an issue with the Annotation panel, it only shows the manually created annotations and not the ones created by the alerting.
Is there a solution to this?
(Using 9.4.3)
I created the rule through the “Create alert rule from this panel” button…
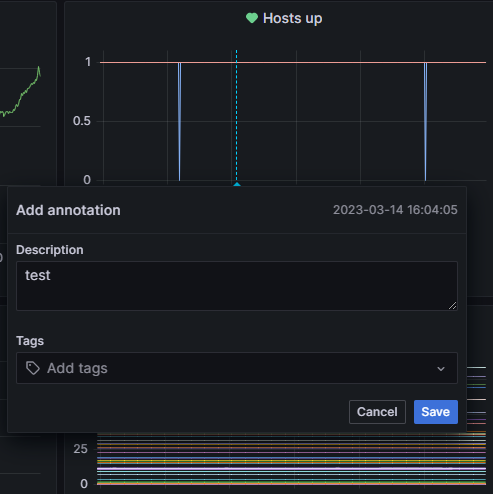
But also manually added annotations do not show up after adding.
I see the marker when trying to add, but after pressing Save the marker disappears.
Alerting also with rendering and sending into a Telegram chat works just fine.
Many thanks in advance!
EDIT: After investigating the issue and restarting several times and also changing annotiation configuration several times it seems to work now, I tried to figure out the one step that fixed the issue but unfortunately I am not able to provide the information…