Hi,
Software:
- InfluxDB version : 1.7.7
- Grafana: 5.4.3
I have an issue with grafana agregation because of no timestamp insert in my InfluxDB database.
Rarely some servers I monitore do not sending data to InfluxDB database (it’s not the probleme here). The result is thtat I have a “hole” on my database (missing timestamp). Below is an exemple.
Query : select “QrySuccess” from “bind” where host = ‘opdnslacbo01’ and time >= ‘2019-07-28T09:14:00Z’ or time <= ‘2019-07-29T09:17:00Z’
2019-07-29T09:10:01Z 9345121868
2019-07-29T09:11:01Z 9345571224
2019-07-29T09:12:01Z 9346014462
2019-07-29T09:15:01Z 9347359809
2019-07-29T09:19:01Z 9349138941
2019-07-29T09:20:01Z 9349594514
2019-07-29T09:21:01Z 9350049323
2019-07-29T09:25:01Z 9351824686
2019-07-29T09:26:01Z 9352281903
2019-07-29T09:27:01Z 9352727074
2019-07-29T09:28:01Z 9353173319
2019-07-29T09:29:01Z 9353624353
In Grafana :

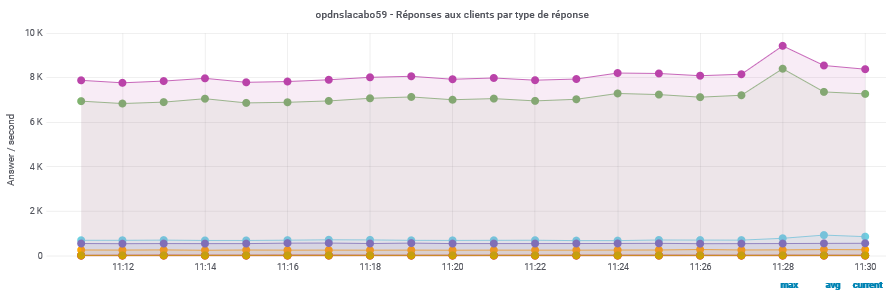
When I try to use agreagation with sum fonction, Grafana I have a big problem. For exemple summon (agregregate) data of the first screen with the next one. The sum of this agregation return very huge and inconsistent value at the time I have not timestamp in my database.
I try to agregate data of all of my server with the query below :
Query : SELECT **non_negative_derivative** ( **sum** ("QrySuccess"), 1s) FROM "bind" WHERE ("host" = ~/^$host$/) AND $timeFilter GROUP BY time(1m) **fill** (0)

I try to fill with null value but this doesn’t work. How I can solve this issue ?
Thanks you for help