My Grafana 11.4.0 runs on Debian Bookworm, MYSQL is 8.33.0
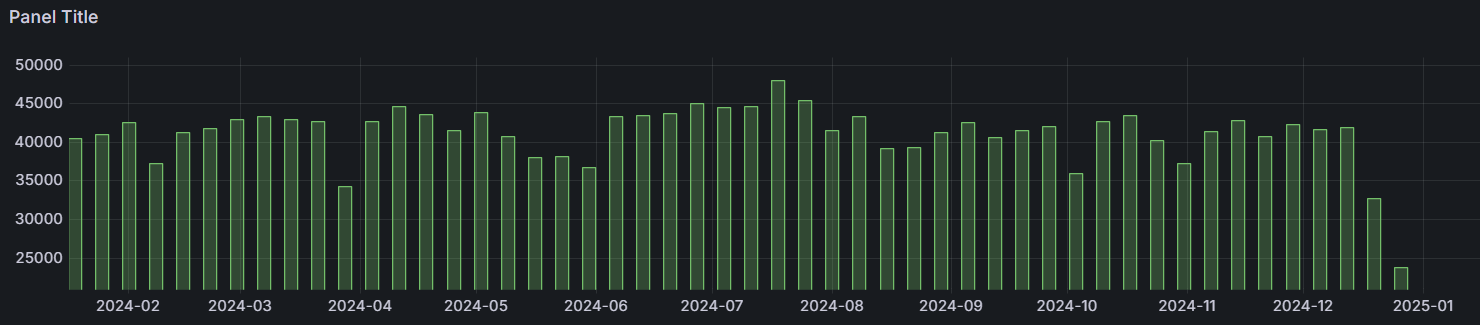
I am analyzing and visualizing street traffic. E.g. vehicles per week.
To make interpretation of data more easy, I want to add a simple linear trend.
Not a big deal for Excel, Google sheets, Adobe, you name it.
I searched the web for hours now, finding tons of hints and self coded examples, but not a single example how to precisely add a trendline to my graph.
Looks like I am too stupid as I can’t belive a sophisticated tool like Grafana can’t deliver such a very basic function.
This is my very simple query:
SELECT
  $__timeGroupAlias(datetime,1w),
  count(speed) AS "vehicles"
FROM trafficdata
WHERE
  $__timeFilter(datetime)
GROUP BY 1
ORDER BY $__timeGroup(datetime,1w)
Any help is very much appreciated
@jangaraj thanks for the link. I did go through this multiple times already, and did find a lot of transformations indeed, but wasn’t able to find/implement a linear trend…
@jangaraj yes I did, the section shows exactly WHAT I want, but can’t find the HOW.
There is also a note:
Note: This transformation is currently in public preview. Grafana Labs offers limited support, and breaking changes might occur prior to the feature being made generally available. Enable the regressionTransformation feature toggle in Grafana to use this feature. Contact Grafana Support to enable this feature in Grafana Cloud.
You have to enable this feature first:
and then you will have that feature available in your Grafana and you can use it
in your ini change this
# enable = feature1,feature2
enable = regressionTransformation
restart grafana =>
1 Like
Hey guys, took me a while to upgrade from 8.x to 11.
Now all is set up and working, a big thank you !
1 Like