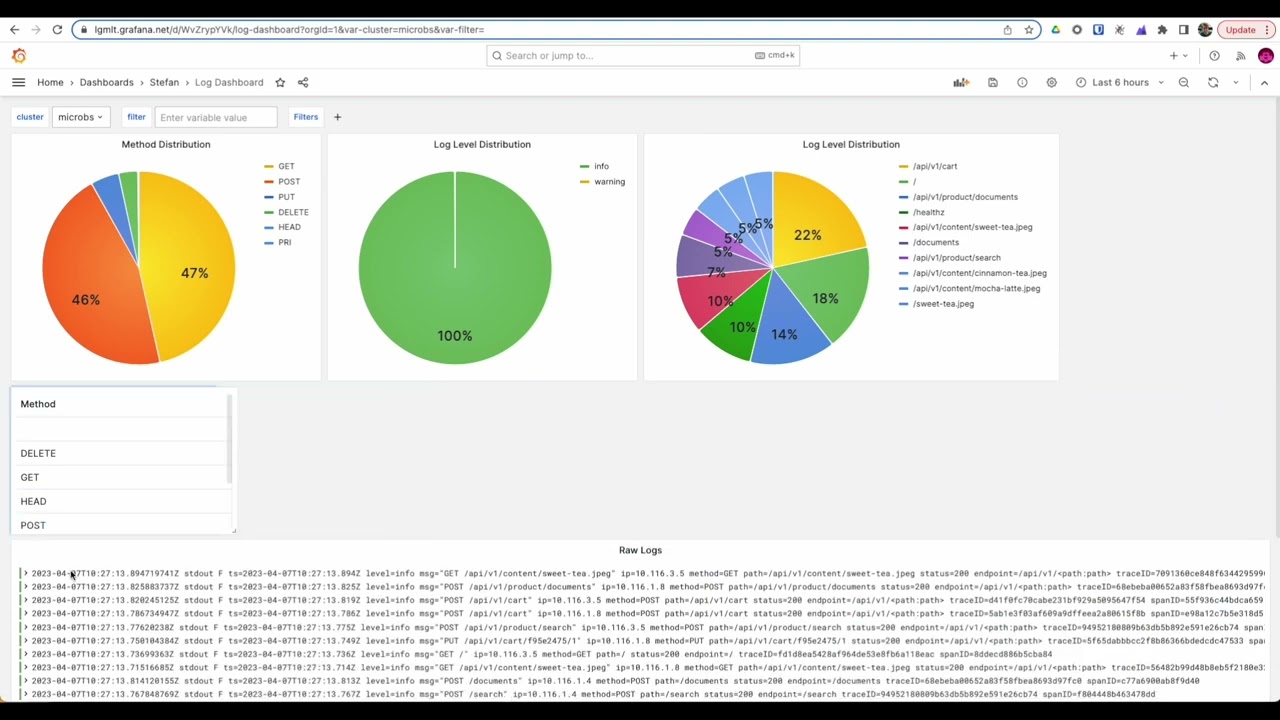
I am new to grafana and I would like to be able to add a filter in the search of my logs for the variables that I can parse in the visualization.
For example in the following image I see two variables in my log: kubernetes.namespace_name and kubernetes.pod_name
How can I add a filter to my dashboard to search for the value of those variables through a checkbox?
Hello @joanarbelaez1
Do you mean switching trough your variables using the whole dashboard:
You can configure variable in your dashboard parameters, then adapt your query to be dependent of the variable.
Or just with the panel?
For example, I make the following query to bring my logs
"fields @timestamp, @message, log, message, level, kubernetes.namespace_name, kubernetes.pod_name
| sort @timestamp desc"
I want to add to my dashboard the ability to filter what the query brings me in the kubernetes.namespace_name and kubernetes.pod_name fields so that the search is dynamic and not generate several dashboards by directly filtering the query.
According to what you told me, is it possible that I execute an additional query “fields kubernetes.namespace_name” and I can convert this into a variable to add to my dashboard?
My expected result for the filter is that everything brought to me by the query “fields kubernetes.namespace_name” remains as a variable in the dashboard, for example
namespace:
- test1
- test2
- test3
Hey @sowdenraymond
Sorry for the delay. If your variable already have the different values you wish to have, you can select it on top of the dashboard, as you showed with your screenshot. If you are not using the variable somewhere in your different panels, that’s basically useless: Grafana get that you select different value for the variable, but since the variable isn’t used there’s nothing to change! You must use your variable in your different query.
For example:
If you have a panel to show the status of different machine and have a variable machine_name, you should build your query with something like (using MySQL example)
SELECT last(status) FROM database WHERE machine_name =~ /^$machine_name$/
With something like that, if you change the value of the variable machine_name, the query will also change.
Hope that helps
1 Like
Hello, the image I posted is an example of the result I want to achieve with the log view but I have not been able to achieve that. So how can I declare that filter in my dashboard with the log view??
Because if I change the view to table format by doing this same query "fields @timestamp, @message, log, message, level, kubernetes.namespace_name, kubernetes.pod_name
| sort @timestamp desc" and activate the filter in that format, I get the result I want but not in the log view but in the table view.
I want to achieve this filter in the log view through variables
Do you have any idea how this filter can be achieved in the log format? @codi639
Hey @joanarbelaez1
Sorry once again for the delay, can you send us the link of the dashboard demo you’re using?
Hey @ joanarbelaez1 have you achieved to build your log table view dashboard with filtering options?
I need a feedback as I am totally new to grafana and need to know if it is possible at all.
Can you please give me some feedback?
Thank you in advance!
BR,
Ivo
I hope that helps with filtering data.
You can use this technique for more than just loki.
Jo


