I added a API key in grafana under configuration menu and tried the below curl command
curl -k -H "Authorization: Bearer <api key>" https://<server>/grafana/api/dashboards/home
I get the below error
[root@localhost ~]# curl -k -H "Authorization: Bearer uchimaku:eyJrIjoiNE02SHVuOE50S0REdEVJTk0xcnZETGtITnZINUdnQXEiLCJuIjoidGVzdCIsImlkIjoxfQ==" https://10.225.114.155/grafana/api/dashboards/home

<!DOCTYPE HTML PUBLIC "-//IETF//DTD HTML 2.0//EN">
<html><head>
<title>401 Unauthorized</title>
</head><body>
<h1>Unauthorized</h1>
In grafana.ini file , I have enabled the API service
[api]
enabled = true
Enabled debug in log level. No info related to the 401 error.
can you please suggest any config change what is causing 401 error
@csudaya Authorization: Bearer API-KEY does not request a username, it should be just a token.
I corrected the curl command as below but still get the same result
curl -k -H “Authorization: Bearer eyJrIjoiYlBYR3o4WWdNOWxkUXgzeWxYM1V2N3NXQlkzYmR6YnIiLCJuIjoidGVzdCIsImlkIjoxfQ==” https://10.225.114.155/grafana/api/dashboards/home
Check the permissions for the dashboard, and the token is still valid. It should work out of the box.
If you are using Grafana 10, try Service Account with proper permissions instead of API keys.
I use Grafana v7.5.15 (NA)
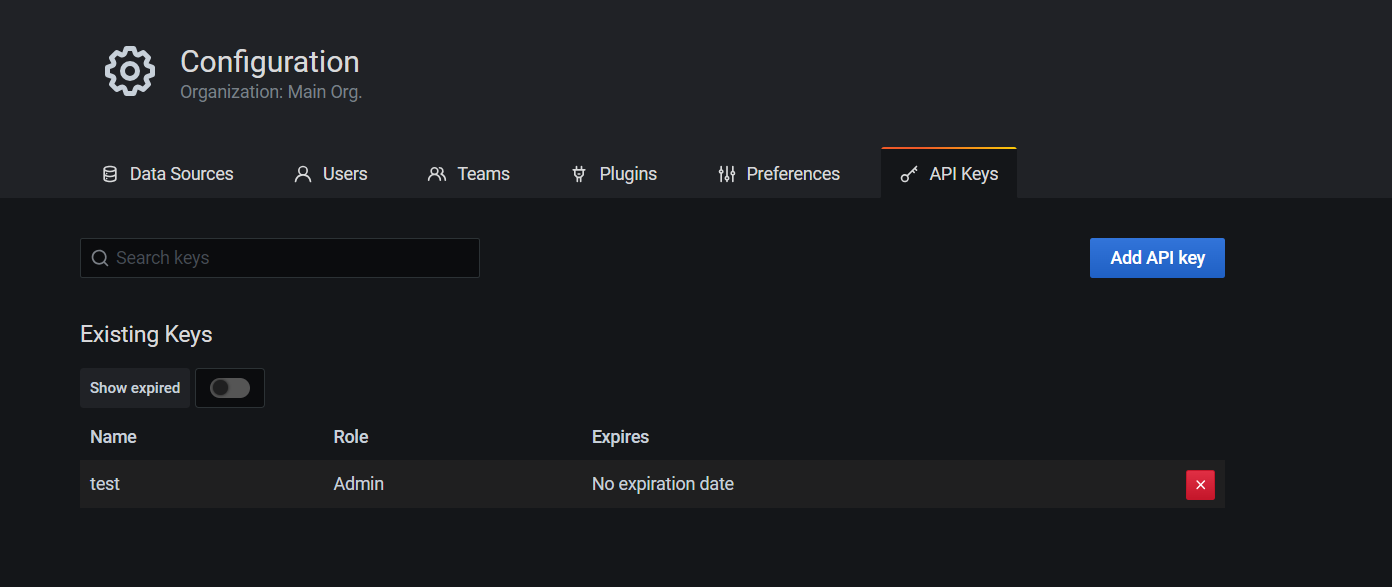
I add API key in the Configuration Menu and then try the curl command. Attached screen snapshots
csudaya
November 8, 2023, 11:08am
6
can anyone reply ? Need this to get this working urgently.
Udaya
It is suspicious that your 401 contains html. I guess that you have some proxy in a place and that’s a response from proxy, not from Grafana. Pls show response headers of that 401 response (curl -v …)
Please find the o/p requested. Iam executing this command on the server on which grafana server is running
[root@site1-pcrfclient01 grafana]# curl -H -k -v “Authorization: Bearer eyJrIjoiSUhNYmlUdjByUTFqeDQ2bzR6UUwxUzZYellCTDVOb24iLCJuIjoidWRheWEiLCJpZCI6MX0=” https://192.168.11.16:3000/grafana/api/dashboards/home
Rebuilt URL to: Authorization: Bearer eyJrIjoiSUhNYmlUdjByUTFqeDQ2bzR6UUwxUzZYellCTDVOb24iLCJuIjoidWRheWEiLCJpZCI6MX0=/
Port number ended with ’ ’
Closing connection -1
Trying 192.168.11.16…
TCP_NODELAY set
Connected to 192.168.11.16 (192.168.11.16) port 3000 (#0 )
ALPN, offering h2
ALPN, offering http/1.1
successfully set certificate verify locations:
CAfile: /etc/pki/tls/certs/ca-bundle.crt
TLSv1.3 (OUT), TLS handshake, Client hello (1):
error:1408F10B:SSL routines:ssl3_get_record:wrong version number
Closing connection 0
[root@site1-pcrfclient01 grafana]# ps -aef | grep grafana
Sorry, this is different error. Topic is about 401 error, not about TLS error. You are mixing two different problems.
csudaya
November 13, 2023, 9:47am
10
[root@localhost ~]# curl -k -v -H “Authorization: Bearer eyJrIjoicnpuRVYwWm1EVkdqWldFT3BKaWlvRk05ZTBzRUVESm0iLCJuIjoidWRheWEiLCJpZCI6MX0=” https://<<server_ip>>/grafana/api/dashboards/home
Trying <<server_ip>>…
TCP_NODELAY set
Connected to <<server_ip>>(<<server_ip>>) port 443 (#0 )
ALPN, offering h2
ALPN, offering http/1.1
successfully set certificate verify locations:
CAfile: /etc/pki/tls/certs/ca-bundle.crt
TLSv1.3 (OUT), TLS handshake, Client hello (1):
TLSv1.3 (IN), TLS handshake, Server hello (2):
TLSv1.2 (IN), TLS handshake, Certificate (11):
TLSv1.2 (IN), TLS handshake, Server key exchange (12):
TLSv1.2 (IN), TLS handshake, Server finished (14):
TLSv1.2 (OUT), TLS handshake, Client key exchange (16):
TLSv1.2 (OUT), TLS change cipher, Change cipher spec (1):
TLSv1.2 (OUT), TLS handshake, Finished (20):
TLSv1.2 (IN), TLS handshake, Finished (20):
SSL connection using TLSv1.2 / ECDHE-RSA-AES256-GCM-SHA384
ALPN, server did not agree to a protocol
Server certificate:
subject: C=IN; ST=TN; L=Chennai; O=CISCO; OU=CPS; CN=localhost; emailAddress=cisco@cisco.com
start date: Apr 8 06:27:29 2019 GMT
expire date: Apr 5 06:27:29 2029 GMT
issuer: C=IN; ST=TN; L=Chennai; O=CISCO; OU=CPS; CN=localhost; emailAddress=cisco@cisco.com
SSL certificate verify result: self signed certificate (18), continuing anyway.
GET /grafana/api/dashboards/home HTTP/1.1/
< HTTP/1.1 401 Unauthorized
401 Unauthorized
Unauthorized
This server could not verify that you
are authorized to access the document
requested. Either you supplied the wrong
credentials (e.g., bad password), or your
browser doesn't understand how to supply
the credentials required.
* Closing connection 0
* TLSv1.2 (OUT), TLS alert, close notify (256):
csudaya:
< Server: Apache
It looks like there is some Apache (maybe it’s also soem Cisco device) between you and Grafana and it looks like this Apache returns 401. So you need to verify how that component (probably Apache) between you and Grafana is configured.
csudaya
November 13, 2023, 11:51am
12
I have a vm where apache & grafana are running
So prove that yout Apache doesn’t block request first.
csudaya
November 13, 2023, 2:04pm
14
Hi ,
I get the below error in httpd log
[Mon Nov 13 13:07:11.600244 2023] [access_compat:error] [pid 772068] [client 192.168.11.21:56534] AH01797: client denied by server configuration: proxy:http://192.168.11.16:3000/api/dashboards/home
Your Apache config requires basich auth. Your API request doesn’t reach Grafana, because your Apache rejects it with 401. This is not a problem with Grafana, but with your Apache config. Please check Apache doc and configure Apache auth that it doesn’t block your API requests.
i met 401 too when i use api requests a few days ago,it looked like it was bean rejected .Even though i used error acount password,it did not return reponse like invalid username or password.Have you solute this error?