Hello,
would like to show 16 Cellvoltages (PV-Battery) in one graph.
do I have to add 16 query or would be easier?
“modbus.0.holdingRegisters.400xy_Cell_Voltage_z”
xy = 16+
z = +
all should have a label “Cell x”
Thx!
Hello,
would like to show 16 Cellvoltages (PV-Battery) in one graph.
do I have to add 16 query or would be easier?
“modbus.0.holdingRegisters.400xy_Cell_Voltage_z”
xy = 16+
z = +
all should have a label “Cell x”
Thx!
that would not scale if tomorrow you have 1600 cell voltages.
what is the bucket design look like? please share bucket schema design, or what fields the bucket has. what differentiates on cell from the other
sry, do not understand what you mean?
16 Cells not less, not more in future
Voltages from 3-3,6V
just do only one query. not 16
please share with us what the fields in the bucket you are querying data from looks like.
google => teilen Sie uns mit, wie die Felder in dem Bucket aussehen, aus dem Sie Daten abfragen.
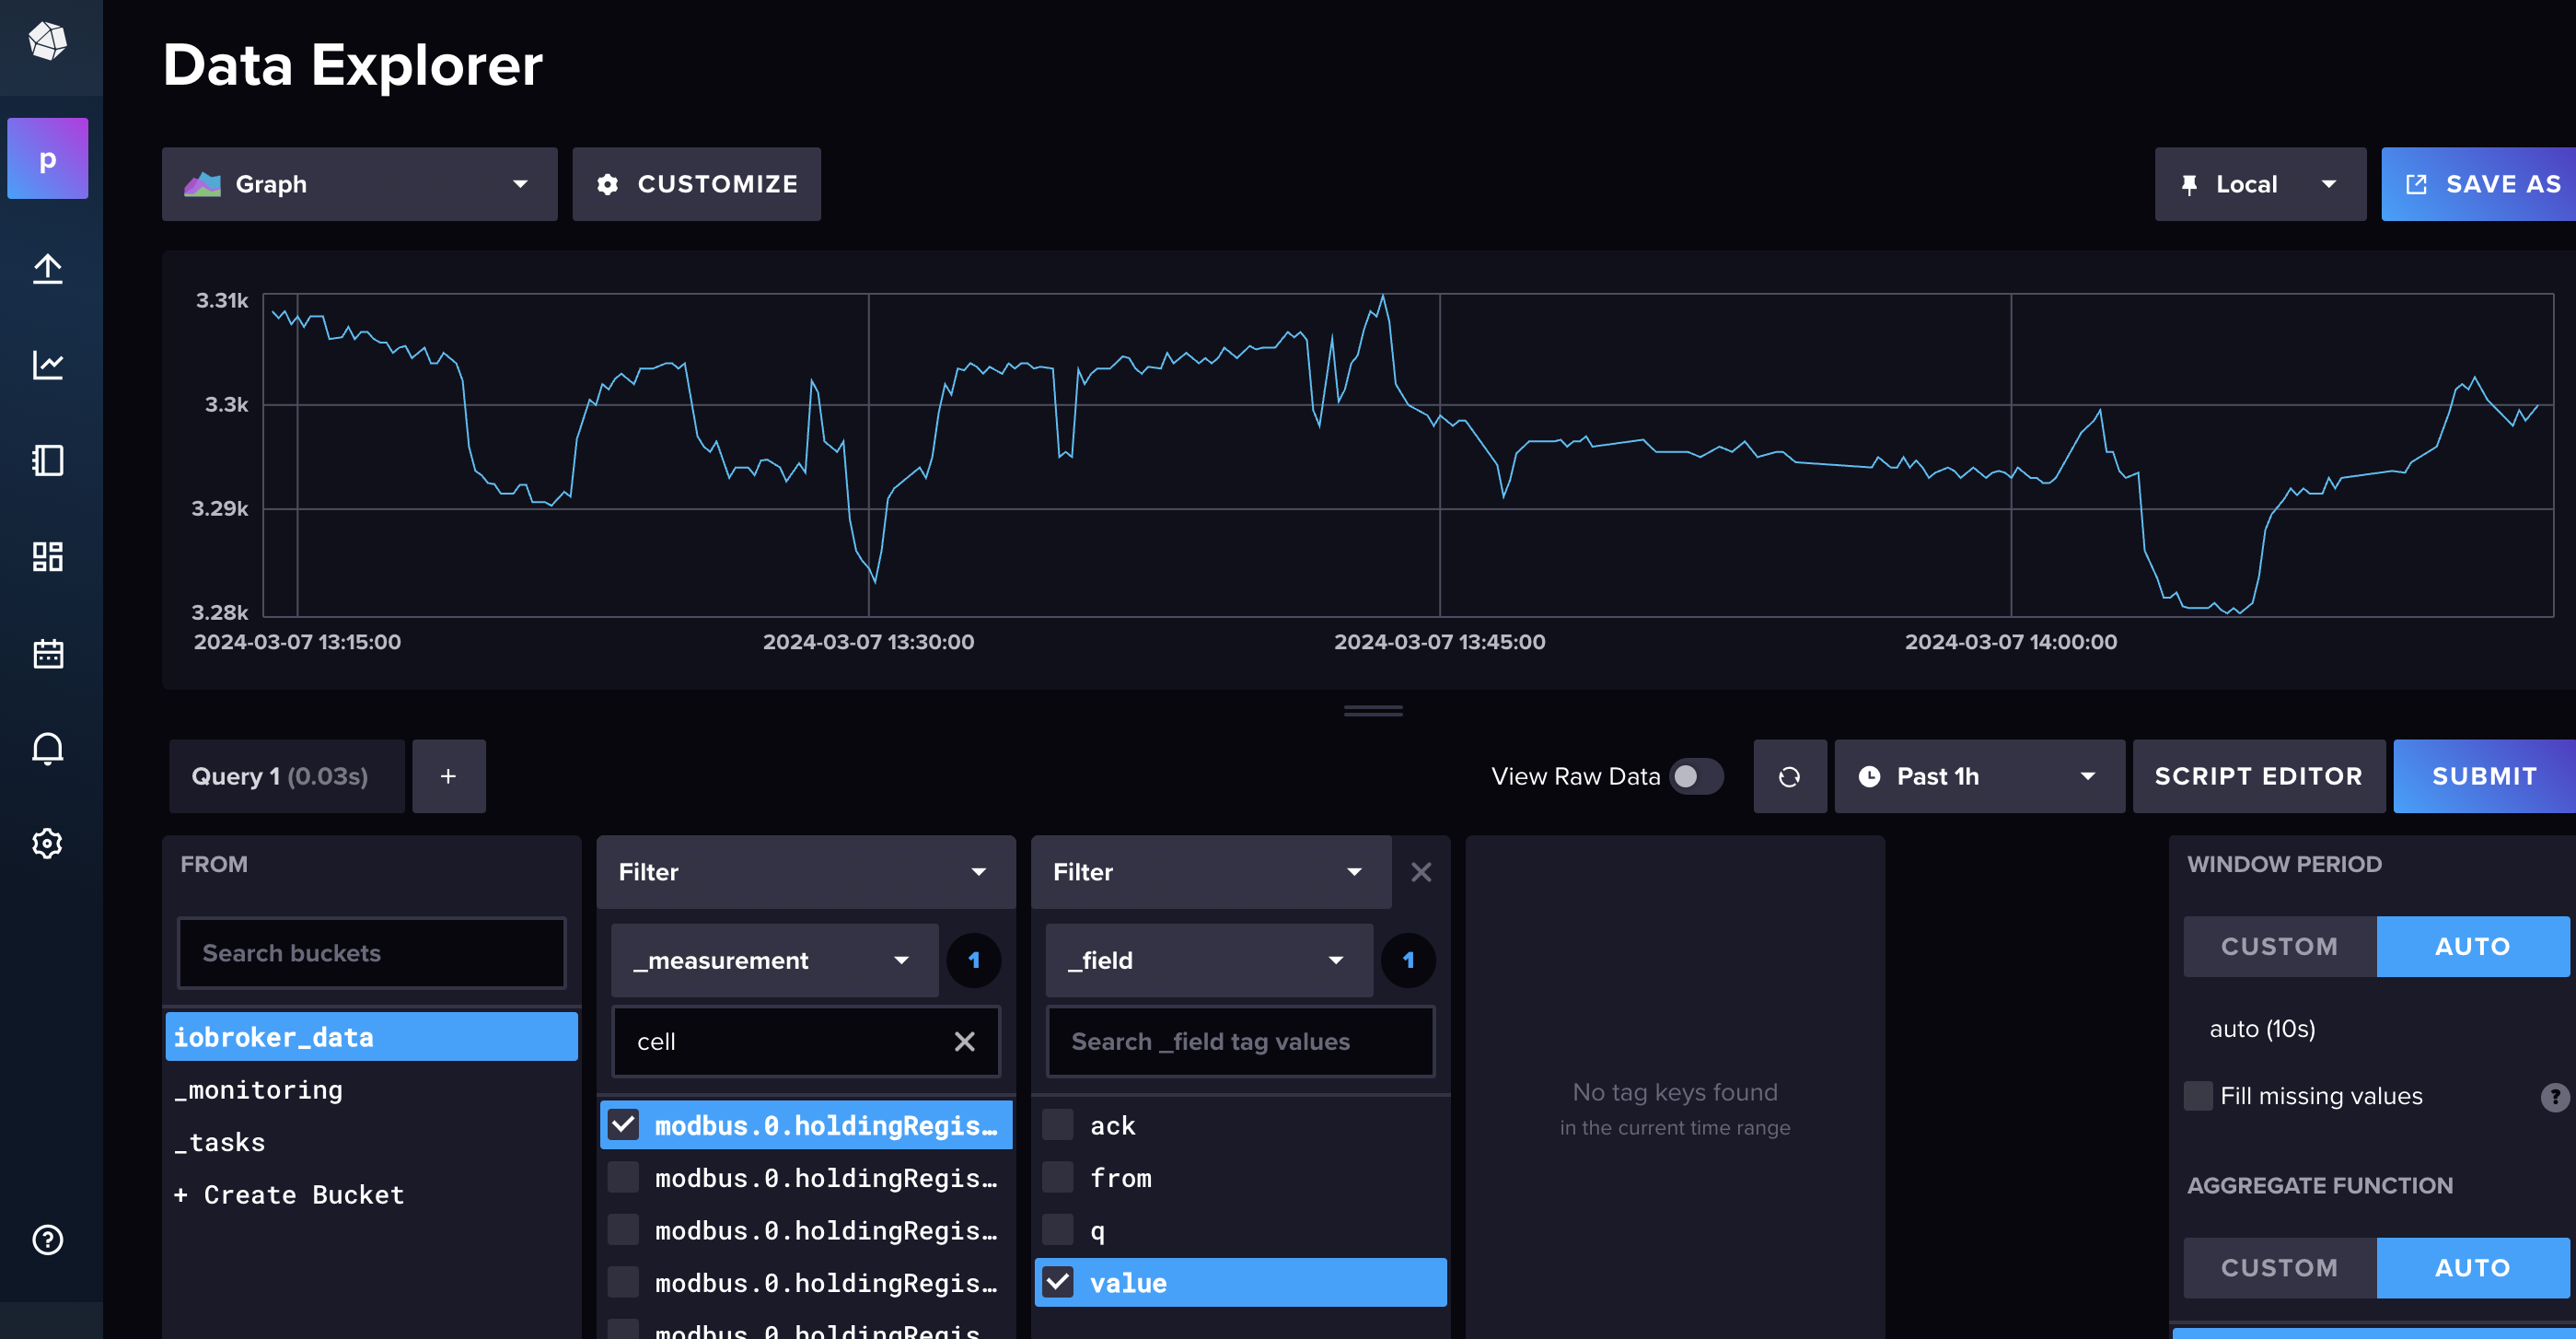
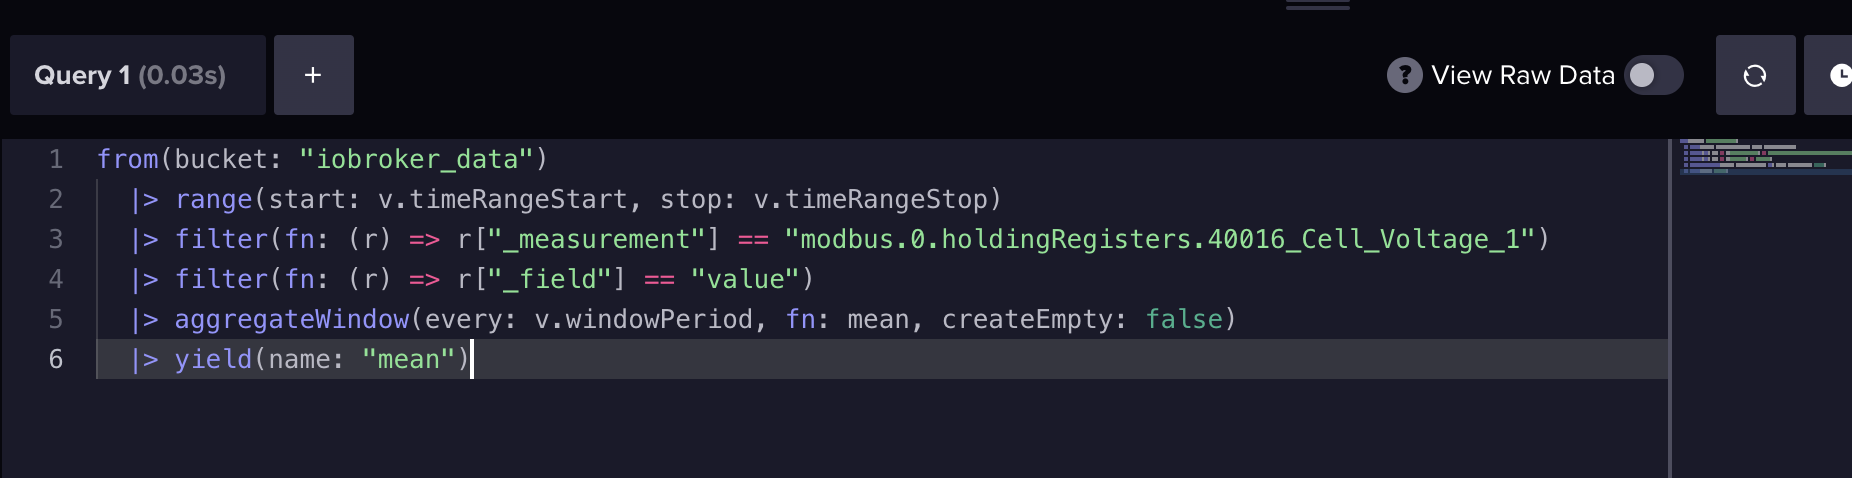
you mean?:
from(bucket: "iobroker_data")
  |> range(start: v.timeRangeStart, stop: v.timeRangeStop)
  |> filter(fn: (r) => r["_measurement"] == "modbus.0.holdingRegisters.40016_Cell_Voltage_1")
  |> filter(fn: (r) => r["_field"] == "value")
  |> aggregateWindow(every: v.windowPeriod, fn: last, createEmpty: false)
  |> yield(name: "last")
not really but it should work. so you have 16 measurements? 1 measurement per cell?
yes, correct
no reply anymore?
Hard to respond when ![]()
That’s a bad schema design for your measurements
So now you will have to modify the query to exclude r["_measurement filter. Remove it and see what happens also disable the other 15 queries for now
sry!
this is an old code I found, I am not familiar with the spelling now, could you pls give me a actual one? THX!
Hi @Austria4711
It is my understanding that you have 16 measurements like this:
modbus.0.holdingRegisters.40016_Cell_Voltage_1
modbus.0.holdingRegisters.40016_Cell_Voltage_2
modbus.0.holdingRegisters.40016_Cell_Voltage_3
....
modbus.0.holdingRegisters.40016_Cell_Voltage_16
If yes, modify your |> filter(fn: (r) => r["_measurement"] to be like this (which could probably be done with Regex, but I am not great with that)…
|> filter(fn: (r) => r["_measurement"] == "modbus.0.holdingRegisters.40016_Cell_Voltage_1" or r["_measurement"] == "modbus.0.holdingRegisters.40016_Cell_Voltage_2" or r["_measurement"] == "modbus.0.holdingRegisters.40016_Cell_Voltage_3" ... etc. r["_measurement"] == "modbus.0.holdingRegisters.40016_Cell_Voltage_16")
Do the above in Influx Data Explorer until you are happy with the results, then copy/paste the query into Grafana. You can clean up the labels in Grafana using Rename by Regex transformation (Cell 1, Cell 2, etc.)
Would just removing that filter work? Unless @Austria4711 has 32 measurements
Yep, I think removing the measurement filter would also do the trick (need another cup of coffee ![]() )
)
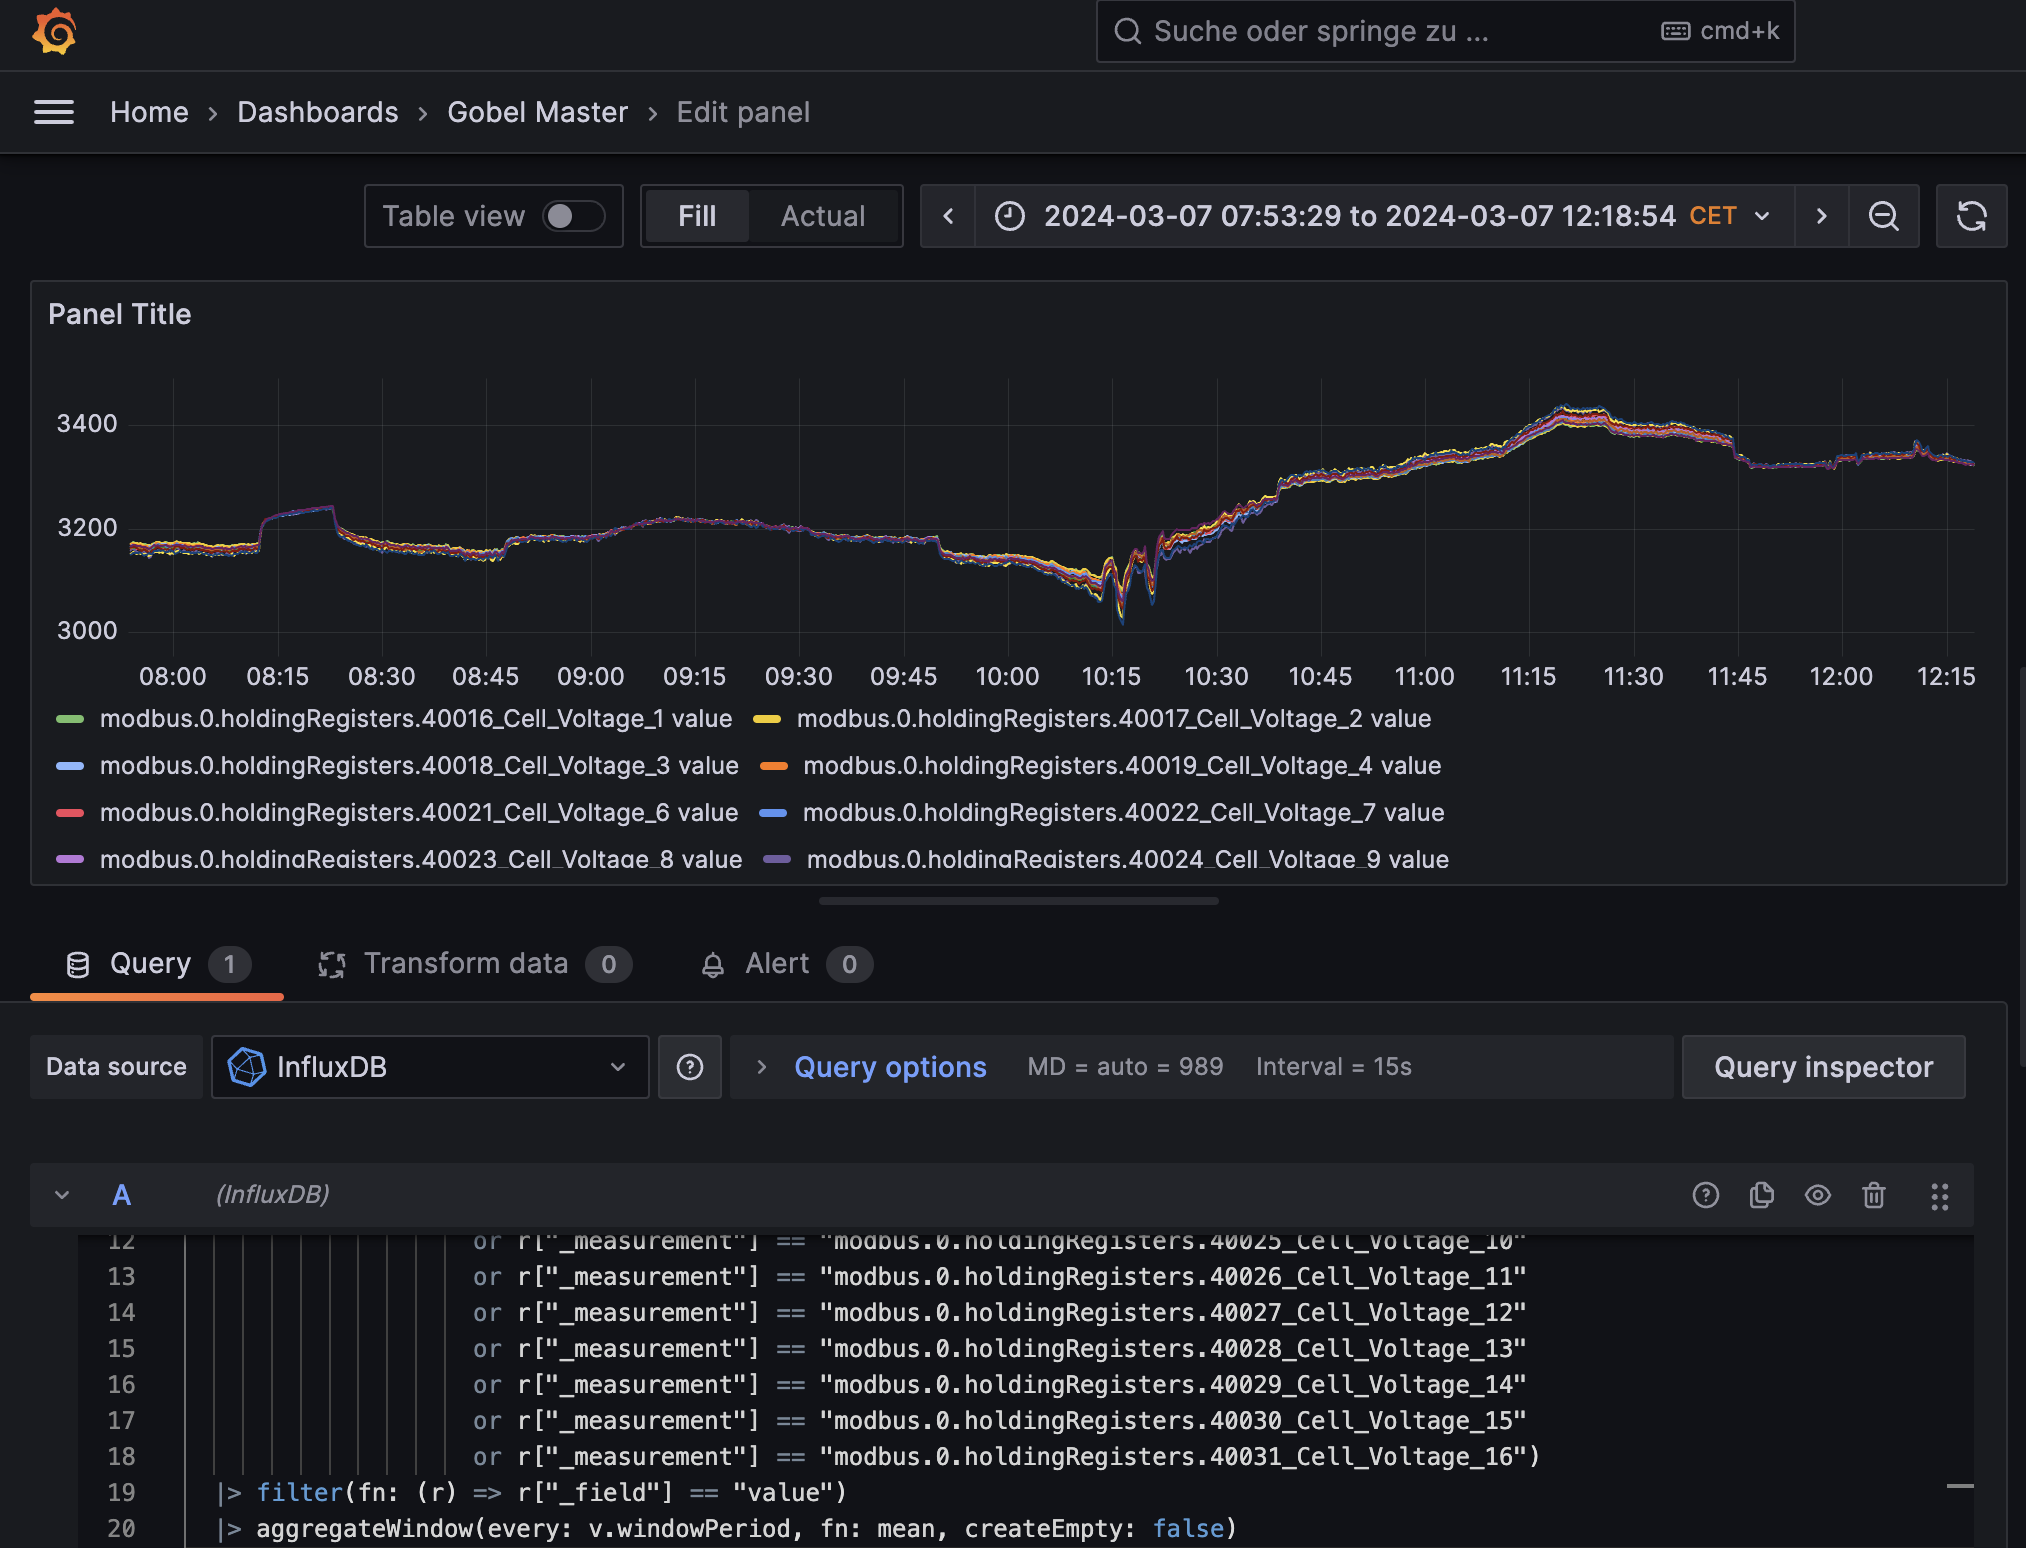
modbus.0.holdingRegisters.40016_Cell_Voltage_1
modbus.0.holdingRegisters.40017_Cell_Voltage_2
modbus.0.holdingRegisters.40018_Cell_Voltage_3
....
modbus.0.holdingRegisters.40031_Cell_Voltage_16
there is no loop possible ?
You dont need loop, follow what has been recommended above. Did you tryany of them?
trying hard…
#bracket was wrong, now working, so just filling in all 16
how do I change the label, what would be “Regex trans…” be?
Try simply removing the measurement filter for now and test query in influxdb not grafana
if I remove the measurement, I get a mix up on all data
could it be like
|> filter(fn: (r) => r["_measurement"] == "modbus.0.holdingRegisters.400xxxxxxxx")