Wrong Elasticsearch query

Hi all. I just started using Grafana but I am experiencing some difficulties with setting Elasticsearch query in Grafana.

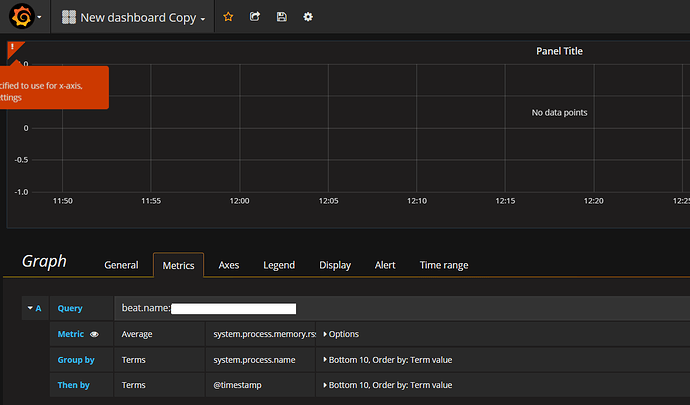
The goal is to create the chart that will display server memory usage per different processes. I defined the following fields:
Query: beat.name:beatServerName
Metric: Average of system.process.memory.rss.bytes
Group by: system.process.name
Then by: @timestamp

But for some reason there is no any data displayed on chart, though the same chart shows data in Kibana.
Could anybody explain what is the issue?

Did you investigate the query sent by grafana and the elasticsearch response? (open chrome dev tools network tab)

Hi Torkel,

This is how request looks:

{"search_type":"query_then_fetch","ignore_unavailable":true,"index":["logstash-2017.05.13"]}
{"size":0,"query":{"bool":{"filter":[{"range":{"@timestamp":{"gte":"1494681900389","lte":"1494703500389","format":"epoch_millis"}}},{"query_string":{"analyze_wildcard":true,"query":"beat.name:ip_address"}}]}},"aggs":{"3":{"terms":{"field":"system.process.name","size":10,"order":{"_term":"asc"},"min_doc_count":0},"aggs":{"2":{"terms":{"field":"@timestamp","size":10,"order":{"_term":"asc"},"min_doc_count":0},"aggs":{"1":{"avg":{"field":"system.process.memory.rss.bytes"}}}}}}}}

This is response:

{"responses":[{"took":1,"timed_out":false,"_shards":{"total":0,"successful":0,"failed":0},"hits":{"total":0,"max_score":0.0,"hits":[]},"status":200}]}

No hits, make sure the lucene filter is correct, are you using correct case (maybe some char needs to be upper case)

In Elasticsearch data source settings I changed Index name to [metricbeat-]YYYY.MM.DD

The query is:

{"search_type":"query_then_fetch","ignore_unavailable":true,"index":["metricbeat-2017.05.13"]}
{"size":0,"query":{"bool":{"filter":[{"range":{"@timestamp":{"gte":"1494701295851","lte":"1494704895851","format":"epoch_millis"}}},{"query_string":{"analyze_wildcard":true,"query":"beat.name:ip_address"}}]}},"aggs":{"3":{"terms":{"field":"system.process.name","size":10,"order":{"_term":"asc"},"min_doc_count":0},"aggs":{"2":{"terms":{"field":"@timestamp","size":10,"order":{"_term":"asc"},"min_doc_count":0},"aggs":{"1":{"avg":{"field":"system.process.memory.rss.bytes"}}}}}}}}

Response:

And now I am getting the error:

No field name specified to use for x-axis, check your axes settings

And these are Axes settings:

By the way, this is the request for the same chart in Kibana:

{"index":["metricbeat-2017.05.13"],"ignore_unavailable":true,"preference":1494699650722}
{"query":{"bool":{"must":[{"query_string":{"query":"*","analyze_wildcard":true}},{"range":{"@timestamp":{"gte":1494704867926,"lte":1494705767926,"format":"epoch_millis"}}}],"must_not":[]}},"size":0,"_source":{"excludes":[]},"aggs":{"2":{"date_histogram":{"field":"@timestamp","interval":"30s","time_zone":"...","min_doc_count":1},"aggs":{"3":{"terms":{"field":"system.process.name","size":20,"order":{"1":"desc"}},"aggs":{"1":{"max":{"field":"system.process.memory.rss.pct"}}}}}}}}

X axis mode should be time series

That helped, thanks a lot. I faced another issue: When I select data range Last 6 hours, there is chart displayed with data, but when I select date range Last 1 hour - there is no any data on chart:

I’ve experienced something similar when my server timestamp didn’t match the expected range.
You might check that the epoch dates being sent are not “in the future” according to the elastic server.

Also check the FAQ section on the community, there is an topic there for that scenario (zoom in and no data)

Data is written to ES every 10s. I set Group by time interval as >20s but I can see chart with data for the period not later then Last 1 hour. Though in Kibana period Last 20s works good and shows the data.
Is it expected result?

Maybe there is a time difference between your ES server or collector and your browser time?

That’s true, browser time is few hours less then ES and Grafana server time. But in this case I should see the data for period Last 15 min. Because the data for Last 15 min period already exists in ES.

You could compare the ES query that Kibana is using to the query that Grafana is producing.
Maybe something else will be revealed.

you can investigate the query & the response, here is a guide: