WorldPing Alert errors / timeouts

Hi folks

Hosted Metrics/Grafana and now trying out WorldPing.

I’m using the Example alerting dashboard for WorldPing provided by Grafana.

https://grafana.com/dashboards/1962

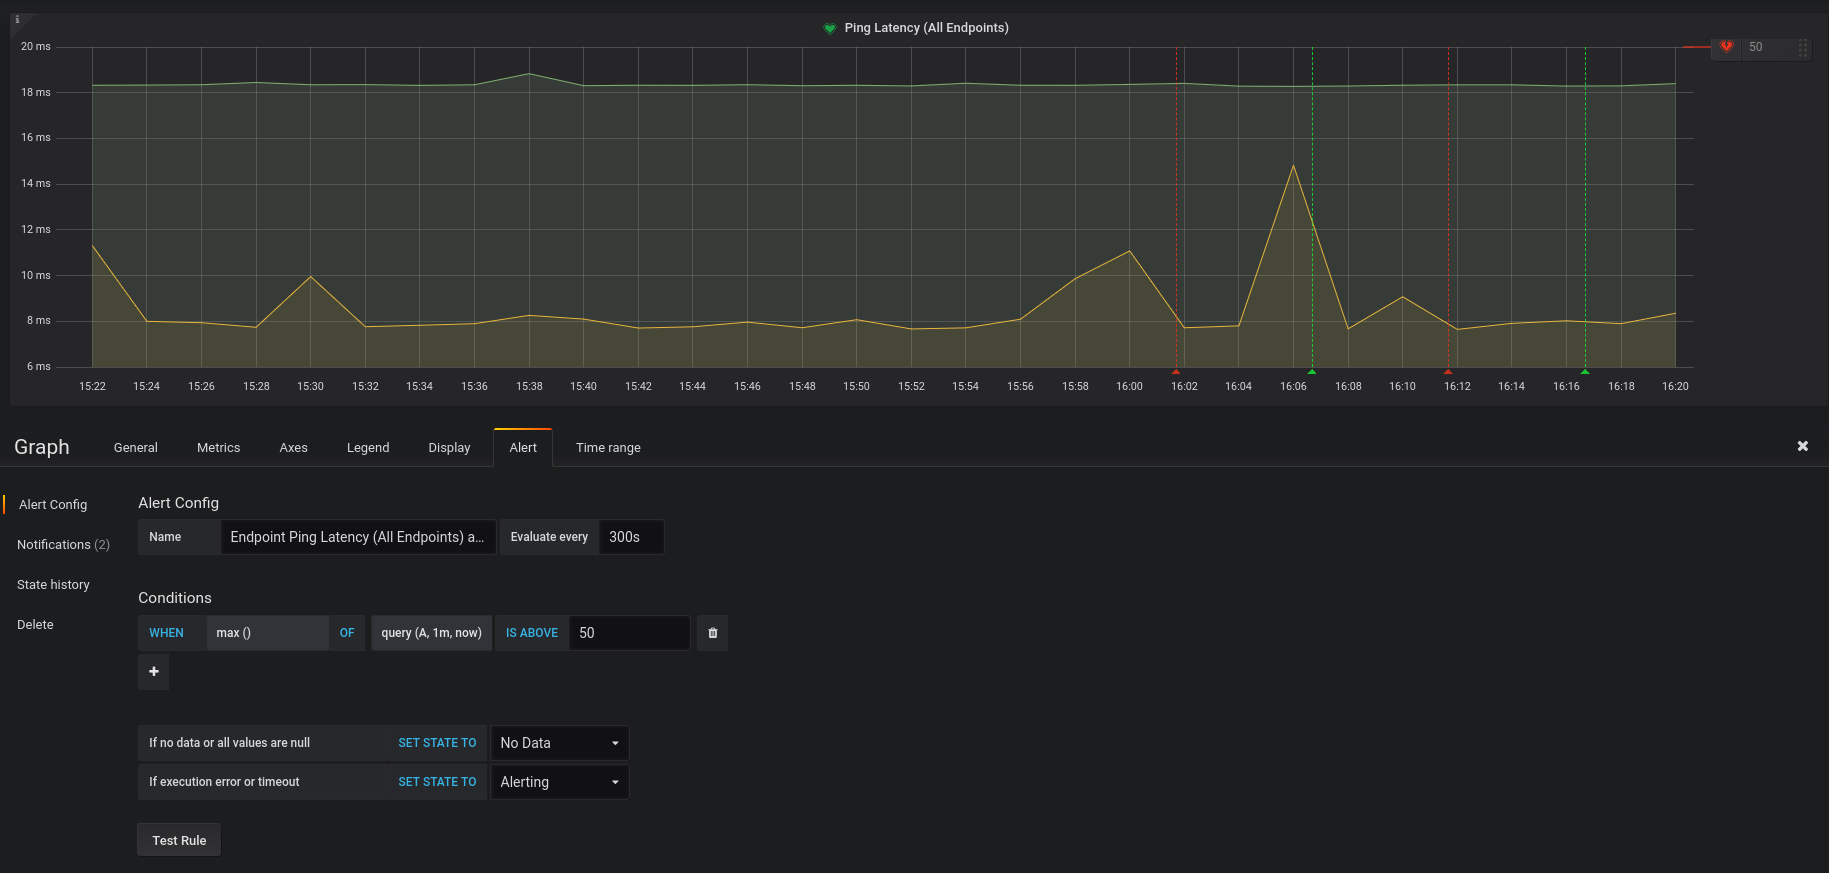
With the default settings, it’s picked up our endpoints just fine. But as soon as I enable alerting, we get alternating check pass/fails (basically; OK, fail, OK, fail, OK, fail). See attached screenshot.

The error we get is:
Error: tsdb.HandleRequest() error Request failed status: 500 Internal Server Error

As this is all Grafana hosted, we’re at the mercy of whoever is managing the environment. Are there any issues?

Cheers
Andy

Hi Andy,
thanks for reporting.
we’re looking into it.
Dieter

Hi Dieter

Did you manage to find anything?

Cheers
Andy

Hi Andy,
yes. there seems to be a bug in our backend which affects queries that have a short timeframe compared to the data resolution (in your case, the alert query queries for 1minute of data but the data resolution is 2 minutes).
Can you try making your alert query for a longer timeframe such as 3 minutes?
In the meantime I’ll keep working on this bug.

Ah, thanks for the confirmation.

I’ll tweak our timeframes and see if I can find a nice middle ground for us at the moment.

Cheers
Andy

Did that help?
I’m still working on the bug.

I upped both the dns and ping timeframes to 3m and all looks fine so far!

Lemme know if you need any 3rd party testing on the bug fixing.

Thanks
Andy

We have the bugfix ready and plan to roll out on monday.
No help is needed, thank you.

note: the deploy of the bugfix is going to take a few days longer. stay tuned… :slight_smile:

Bugfix is now deployed.

Cheers! I’ll test out a few timeframes and see what happens :slight_smile: