No need to apologize. No infection symptoms
So if you see an issue you can submit it here for example
No need to apologize. No infection symptoms
So if you see an issue you can submit it here for example
@yosiasz
Fyi because we had to build more advanced dashboard we had to try flux. While the flux query syntax is well documented and there is lots of examples, its still tricky to use in in grafana panels.
Grafana has grafana demo dashboard and that’sa good idea, but it is not labeled that some queries are in flux. Some tables also look bad:
https://play.grafana.org/d/iZYe3m2Gz/influx-2-2-internal-metrics?orgId=1&viewPanel=15
Luckily i found tis one Grafana, otherwise i would have to spend another day jus to make the results show in table…
In addition even if flux is advertised and powerful querry language and pefromance is stressed it is painfully slow when compared to influqQL. I had to change the timeout settings and eg. query time for my data was 56 seconds…
It does not look as mature and peformant technology rather than experimentar feature that is still being developed.
My experience since switching from InfluxQL to Flux has been the opposite, i.e. MUCH faster querying of years’ worth of data. There must be some reason why your queries have become so much slower.
@grant2 ok maybe you can advice on this
i found this Performance difference between Flux and InfluxQL · Issue #18088 · influxdata/influxdb · GitHub
Maybe you can give me some hint or maybe you have some insight (I do not expect solution but more hints).
We are using influx 1.8.10 and grafana 9.1.6. Now I am aware influx 1.8 is a bit old, but updating it to 2.0 requires data migraton which is a bit risky - we want to avoid doing it, since we have huge amount of data, and we are not very confident it will work smoothly
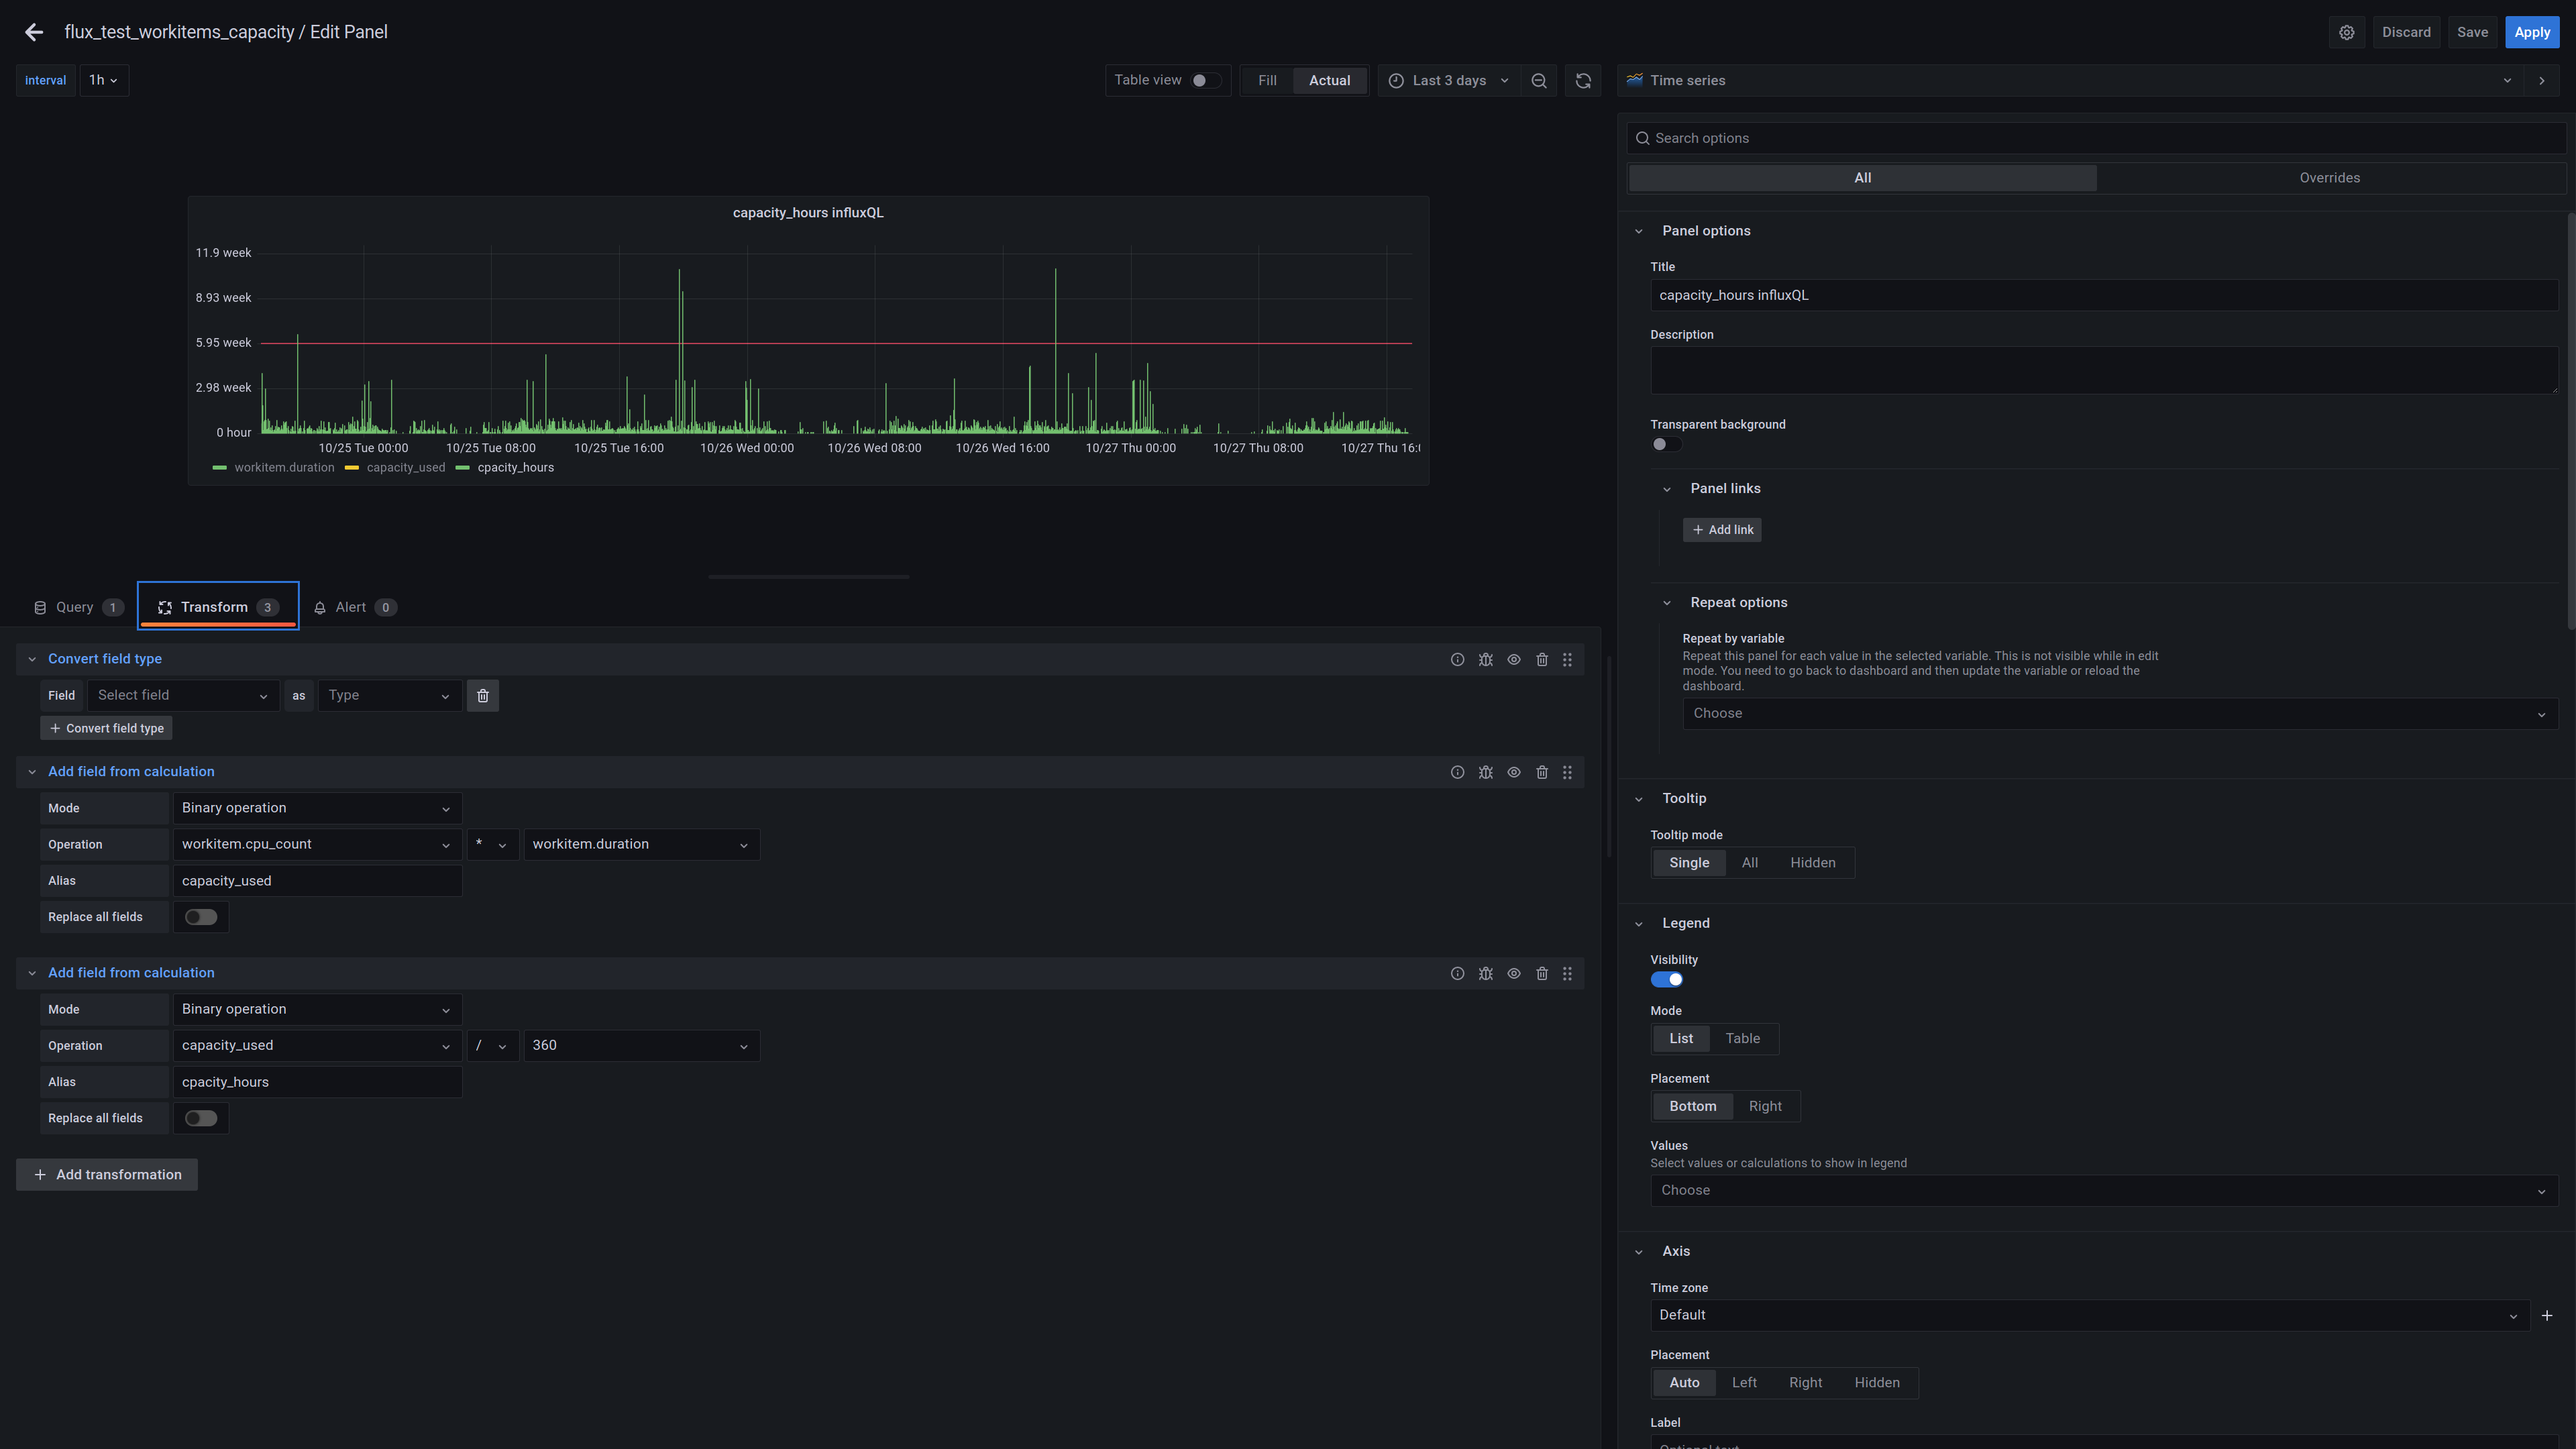
here is the dashboard:
https://testresults.qt.io/grafana/d/hb8ZpTH4k/flux_test_workitems_capacity?orgId=1
the dashboard should show integration system cpu capacity. The basic unit is workitem (equivalent to build atifact) we multiply duration by cpu used, and we try to group by by 1 hour if possible
The 2 time series panes are not exactly same - since influxQL and FLUX have different possiblities, but they try to achieve same goal - capacity of integration system expressed in cpu hours.
From grafana stats
data fetching took 11 secs 2 379 360 rows using influxQL
and 54 secs using Flux and 23 rows…
this is the schema for workitem:
results": [
{
“statement_id”: 0,
“series”: [
{
“name”: “workitem”,
“columns”: [
“time”,
“branch”,
“computeHost”,
“cpu_count”,
“duration”,
“host_arch”,
“host_compiler”,
“host_os”,
“host_os_version”,
“id”,
“path”,
“platform_id”,
“project”,
“sha1”,
“state”,
“target_arch”,
“target_compiler”,
“target_os”,
“target_os_version”,
“taskType”,
“type”
],
there is one thing that i know can slow us down (cpu was mistakenly stored as string) so we convert it - but its a bug that will be fixed in few days. But even ignoring it its still much slower than QL. Even if i only fetch workitems without checking details.
Would you be able to share the actual queries behind each of these panels? I can see that Flux is much slower. I am sure there is a reason for this.
@grant2
Hi, yes:
grafana variables:
timeFilter is set to latst 3 days (now() - 3d)
interval:
1h
duration field from “workitem” is expressed in seconds, that is why we divide the number by 360 to get hours
influxQL:
SELECT* from workitem where $timeFilter
Query inspector:
Stats
Total request time 6.54 s
Data processing time 0.100 ms
Number of queries 1
Total number rows 1242380
FLUX:
from(bucket:“coin”)
|> range(start: v.timeRangeStart, stop:v.timeRangeStop)
|> filter(fn: (r) => r._measurement == “workitem” and r._field == “duration”)
|> map(fn: (r) => ({cpu_usage: int(v: r.cpu_count) * int(v: r._value)/3600, time: r._time }))
|> duplicate(column: “time”, as: “_time”)
|> aggregateWindow(every: ${interval}, fn: sum, column: “cpu_usage”)
Query inspector
Stats
|Total request time|57.2 s|
| — | — |
|Data processing time|0.200 ms|
|Number of queries|1|
|Total number rows|29|
It’s difficult to say why the Flux query takes so long, but I would speculate that maybe it is due to one or both of these lines:
|> map(fn: (r) => ({cpu_usage: int(v: r.cpu_count) * int(v: r._value)/3600, time: r._time }))
|> duplicate(column: “time”, as: “_time”)
Not sure of the best way to troubleshoot without having a copy of your data, so perhaps you could try this query to see how long it takes?
timeFilter is set to last 3 days, interval: 1h
from(bucket:“coin”)
|> range(start: v.timeRangeStart, stop:v.timeRangeStop)
|> filter(fn: (r) => r._measurement == “workitem”)
|> filter(fn: (r) => r._field == “duration”)
|> map(fn: (r) => ({r with _value: r._value/3600}))
|> aggregateWindow(every: ${interval}, fn: sum, createEmpty: false)
|> yield(name: "test1")
Also, I wrote 3600 above because that was in your query, but did you mean 360?
@grant2
I will just respond shortly in your query the cpu_count is missing,
(we need to multiply duration by cpu to get the cpu usage)
but I get the point I need to have a look since I am still learning Flux so it might be that the query is an issue/slowdown.
the 3600 is a typo indeed
I am not sure how much data is public, the dashboards are public, but yeah there are policies in each companies.
but thank you for trying
Anna
As a minimum, in your original query, you should probably change the above line to
|> map(fn: (r) => ({cpu_usage: int(v: r.cpu_count) * r._value/360.0, time: r._time }))
the 360.0 tells Influx that it’s a float.
Also, I realize that in my test query the cpu_count is missing. I just want to see if the query performs fast and then we can add in the complex stuff later.
Does this query work?
from(bucket:“coin”)
|> range(start: v.timeRangeStart, stop:v.timeRangeStop)
|> filter(fn: (r) => r._measurement == “workitem” and r._field == “duration”)
|> map(fn: (r) => ({ r with cpu_usage: (r.cpu_count * r._value/360.0)}))
|> aggregateWindow(every: ${interval}, fn: sum, column: “cpu_usage”)
|> yield(name: "test2")
there could be tons of reasons why things are slower other than flux itself. but you have indicated in previous threads that you do not have the time to parse through documentation so I will spare you that headache.
@yosiaz
“you do not have the time to parse through documentation’”
that’s very disrespectful comment and should be moderated.
the point is what is reasonable time to go through the documentation.
Do you work at grafana?
I already at lest here commented issues in grafana demo. In addition even if I go through grafana presentation and I try to map it to my version there is an issue - since versions do not match.
Unless you provide very high quality documentation and it is consistent - then I can go. But it is not the case.
In addition I was not working on the problem alone, but other ppl working in the company were checking things.
No disrespect intended. if you feel that way I don’t mind if it is moderated.
that you do not have the time to parse through documentation
What I try to say is grafana examples and documentation is not consistent. You do lots of breaking changes. Its very hard to keep track. For the moment I try to identify the issue with flux query - and even changing to flux (and this part is at least well covered in examples) - then updating grafana panels to use flux is not so easy-peasy. But yes I was willing to put effort.
Providing consisent documentation really saves time people from asking questions and those discussions.
Your query works, but again its 55 seconds. I added it to the dashboard to compare
Stats
| Total request time | 55.4 s |
|---|---|
| Number of queries | 1 |
| Total number rows | 73 |
Where I am its 20:36 now (8:36 pm) I need a break for today, will not check answers.
Also there are small technical differences:
U+201D : RIGHT DOUBLE QUOTATION MARK {double comma quotation mark}
U+0022 : QUOTATION MARK {double quote}
the quotation marks you used in your queries are not accepted by grafana version I use so I changed this.
Thank you.
Yes the docu can at times be hard to parse (I agree)
this happens when the code it not wrapped with code markers
|> filter(fn: (r) => r._measurement == “workitem” and r._field == “duration”)
|> filter(fn: (r) => r._measurement == "workitem" and r._field == "duration")
I am going to close this thread as it has been marked as resolved and you can open a new one so that it gets more visibility.