I can’t figure out what I’m doing wrong. Trying to graph bytes_in/bytes_out of an EC2 instance using:
SELECT derivative(mean("bytes_recv"), 1s) FROM "net" WHERE ("interface" = 'eth0' AND "host" = 'host01') AND $timeFilter GROUP BY time($__interval), "interface" fill(0)
This is how it looks in Grafana v6.2.1:

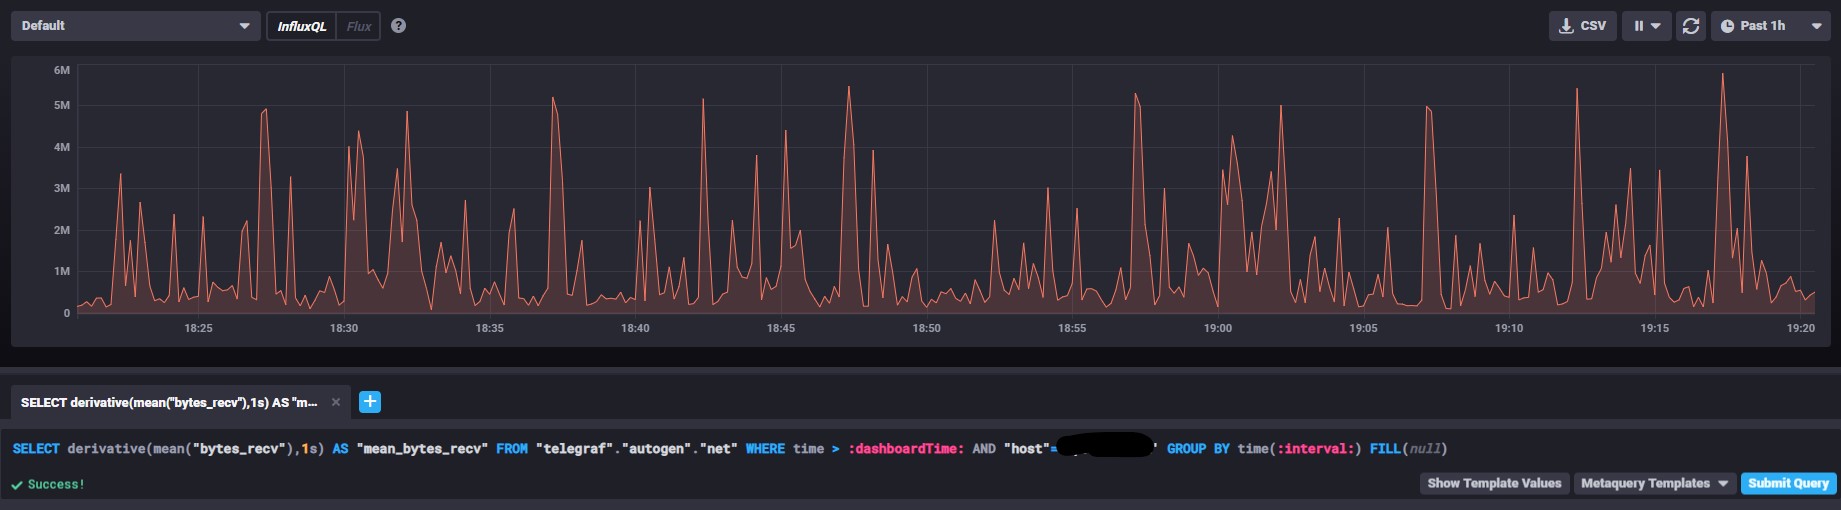
The data appears to be okay under Chronograf: