Hi, i am trying to create a stacked bar graph like this

I have the log lines in the following format
[25/Sep/2023:12:08:00 +0530] | 200 | 4 ms | 781 B | 172.31.0.88 | - | - | - | “GET /fcs/servlet/fcs/about HTTP/1.1”
on the stacked bar graph on x axis i want the time from logline that is 12:08:00, on the y axis i want the sum of bytes for every service. the service in this log line is fcs in the uri path if log line.
so within a specific time frame i want the sum of bytes for every service, so the break down has to be for service, every service a different color.
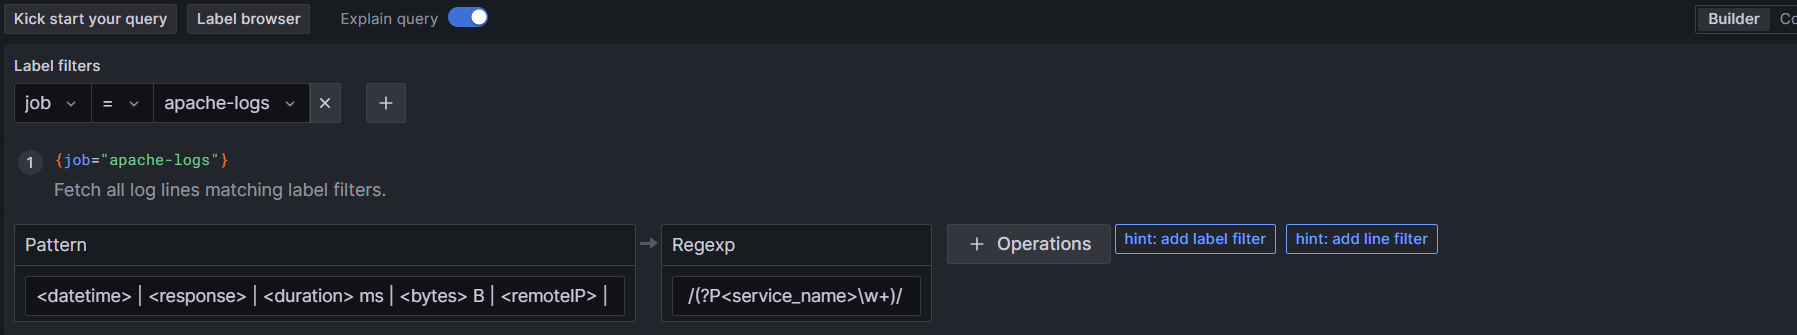
I have used the pattern format operation to parse the logs
<datetime> | <response> | <duration> ms | <bytes> B | <remoteIP> | <clientIP> | <token> | - | "<method> <url> <protocol>"
and regex to fetch the service name
for the dashboard i have done the following

i have set color by field to service_name in bar chart settings.
Now i want to change the color for every service, if i try to do it it says label fcs not found.

i am completely new to grafana dashboards. i have build the graph shown in the first image in kibana. but we are navigating to grafana, so want to achieve similar or better results here. PLs guide me thorugh the steps, in detail