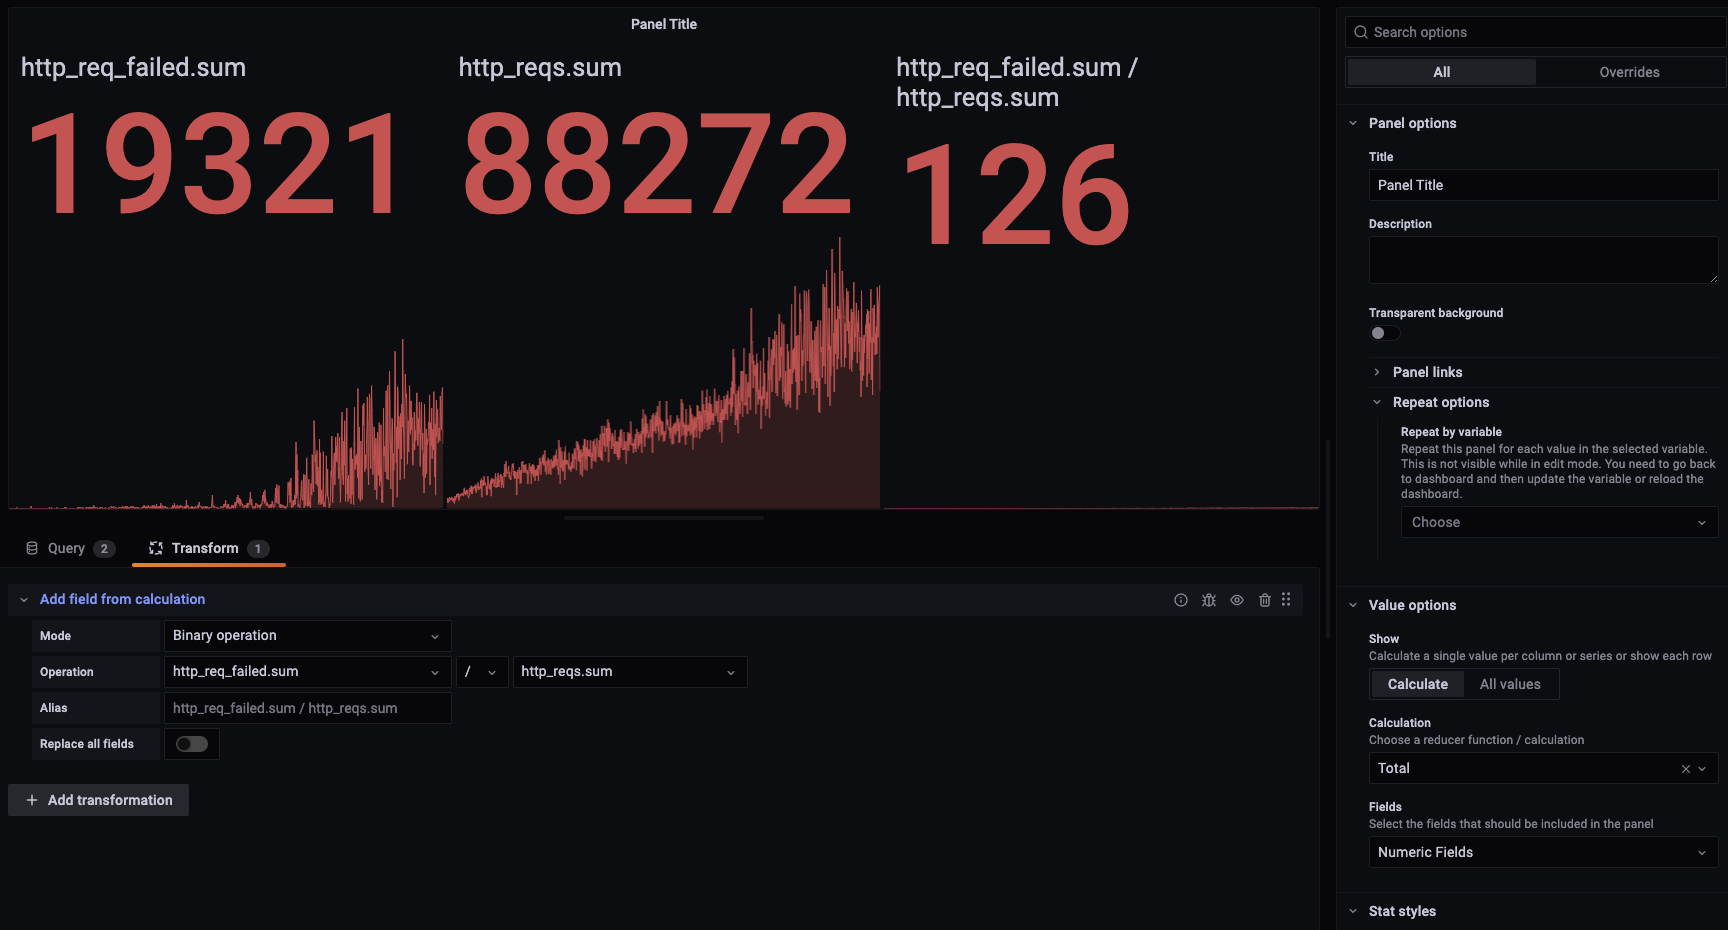
Hello, I’m trying to make a panel that would show error rate for requests made during a performance test (using K6). But once I apply the division transformation the results don’t make sense:
I don’t think I’m doing anything too fancy or weird. The number on the left is smaller than the number on the right, yet doing A/B ends up with 126 which is wrong.
Can anyone point me in the right direction, thank you very much.
Hello @anon70503803 , thanks
so I think I’ve figured out what Grafana’s doing that I’m not expecting it to, but I don’t know how to solve it.
This is what format as table looks like (but with 1731 rows):
Using the query inspector I downloaded the data as a CSV and opened it on excel, so what is happening is that for each row Grafana calculates the failure rate correctly, but in the end the number it decides to print is the sum of every entry of the failure rate row instead of the sum_of_failures / sum_of_requests like the UI leads me to believe I’m doing.
Advise on how to proceed would be appreciated.
And to answer your question, multiplication has the same problem (on addition and subtraction order of operation doesn’t make a difference so the issue is hidden).
Another thing weird, on the query inspector there’s some query duplication I have no idea why it’s happening:
Ok I found the answer to this problem on Grafana 11.5.
First create 2 queries, one for each metric. Add a legend to these queries so that the get then usable as “Fields”. See picture below : ModSecCount will become a usable field.
Actually, my previous answer didn’t include the multiply by 100 and was then not a real percentage calculation. I came up with an even simpler solution which doesn’t need transformations, just a Math expression at the end.