Thanks a lot for the clarifications. I’ve been able to conduct some research and experimentation which, I believe, might be helpful to you. Let me know if that’s the sort of things you were indeed looking for.
Using a test script of my own, which tries to reproduce a workflow roughly similar to what you showed:
const products = new Array("hoodie", "beanie", "belt", "cap", "polo");

export default function () {
  const randomProduct = products[Math.floor(Math.random() + products.length)];
  const response = http.get(
    "http://ecommerce.test.k6.io/product/" + randomProduct + "/"
  );

  check(
    response,
    {
      "is status 200": (r) => r.status == 200,
      "text verification": (r) => r.body.includes(randomProduct),
    },
    {
      status: response.status,
      name: "this is request A",
      failure_reason: response.error,
    }
  );

  sleep(Math.random() * 5);
}
N.B I add tags to my checks here. One of the response status, one for what I interpreted as what you call “transaction name”, finally one for the reason of a failure (if empty, then no failure; we can filter it out later).
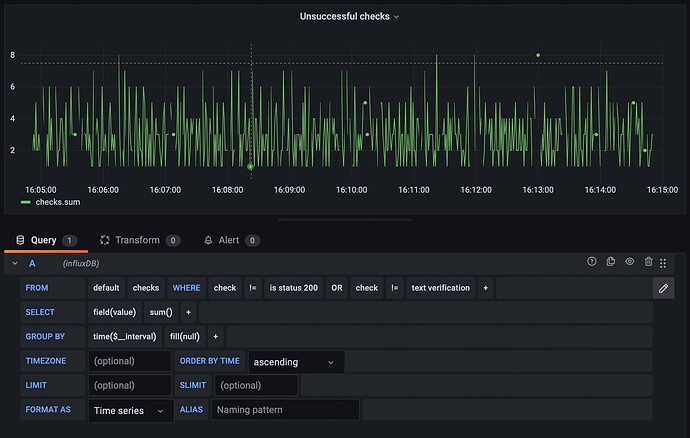
My test setup runs the script, sends the output to InfluxDB, and graphs the results in Grafana using the dashboard you pointed out. I’ve added three panels to Grafana to try to address your need based on my script test modifications.
To address your point 1.:
To address your point 2.:
To address your point 3:
Although I’m more used to Prometheus, my experience of Time Series databases is that although we call them “databases”, they’re really “tagged series”. I find this helpful to think of them in different terms because that helps to adjust our mental models. InfluxDB also reused some terminology from the SQL world, which I believe leads to unjustified expectations regarding how to interact with their system. That’s unfortunate. I found during this investigation that InfluxDB has a great documentation page explaining how things are described under the hood.
Let me know if that’s helpful 


