- What Grafana version and what operating system are you using?
v10.1.5
- What are you trying to achieve?
Grouping by label
- How are you trying to achieve it?
sum(
rate(container_cpu_usage_seconds_total[15m]))
by (namespace)
- What happened?
The total is still showing in the graph.
- What did you expect to happen?
I would expect only a graph for each namespace. How can I remove the total from the graph?
- Can you copy/paste the configuration(s) that you are having problems with?
sum(
rate(container_cpu_usage_seconds_total[15m]))
by (namespace)
- Did you receive any errors in the Grafana UI or in related logs? If so, please tell us exactly what they were.
No
- Did you follow any online instructions? If so, what is the URL?
No
Here is the graph:
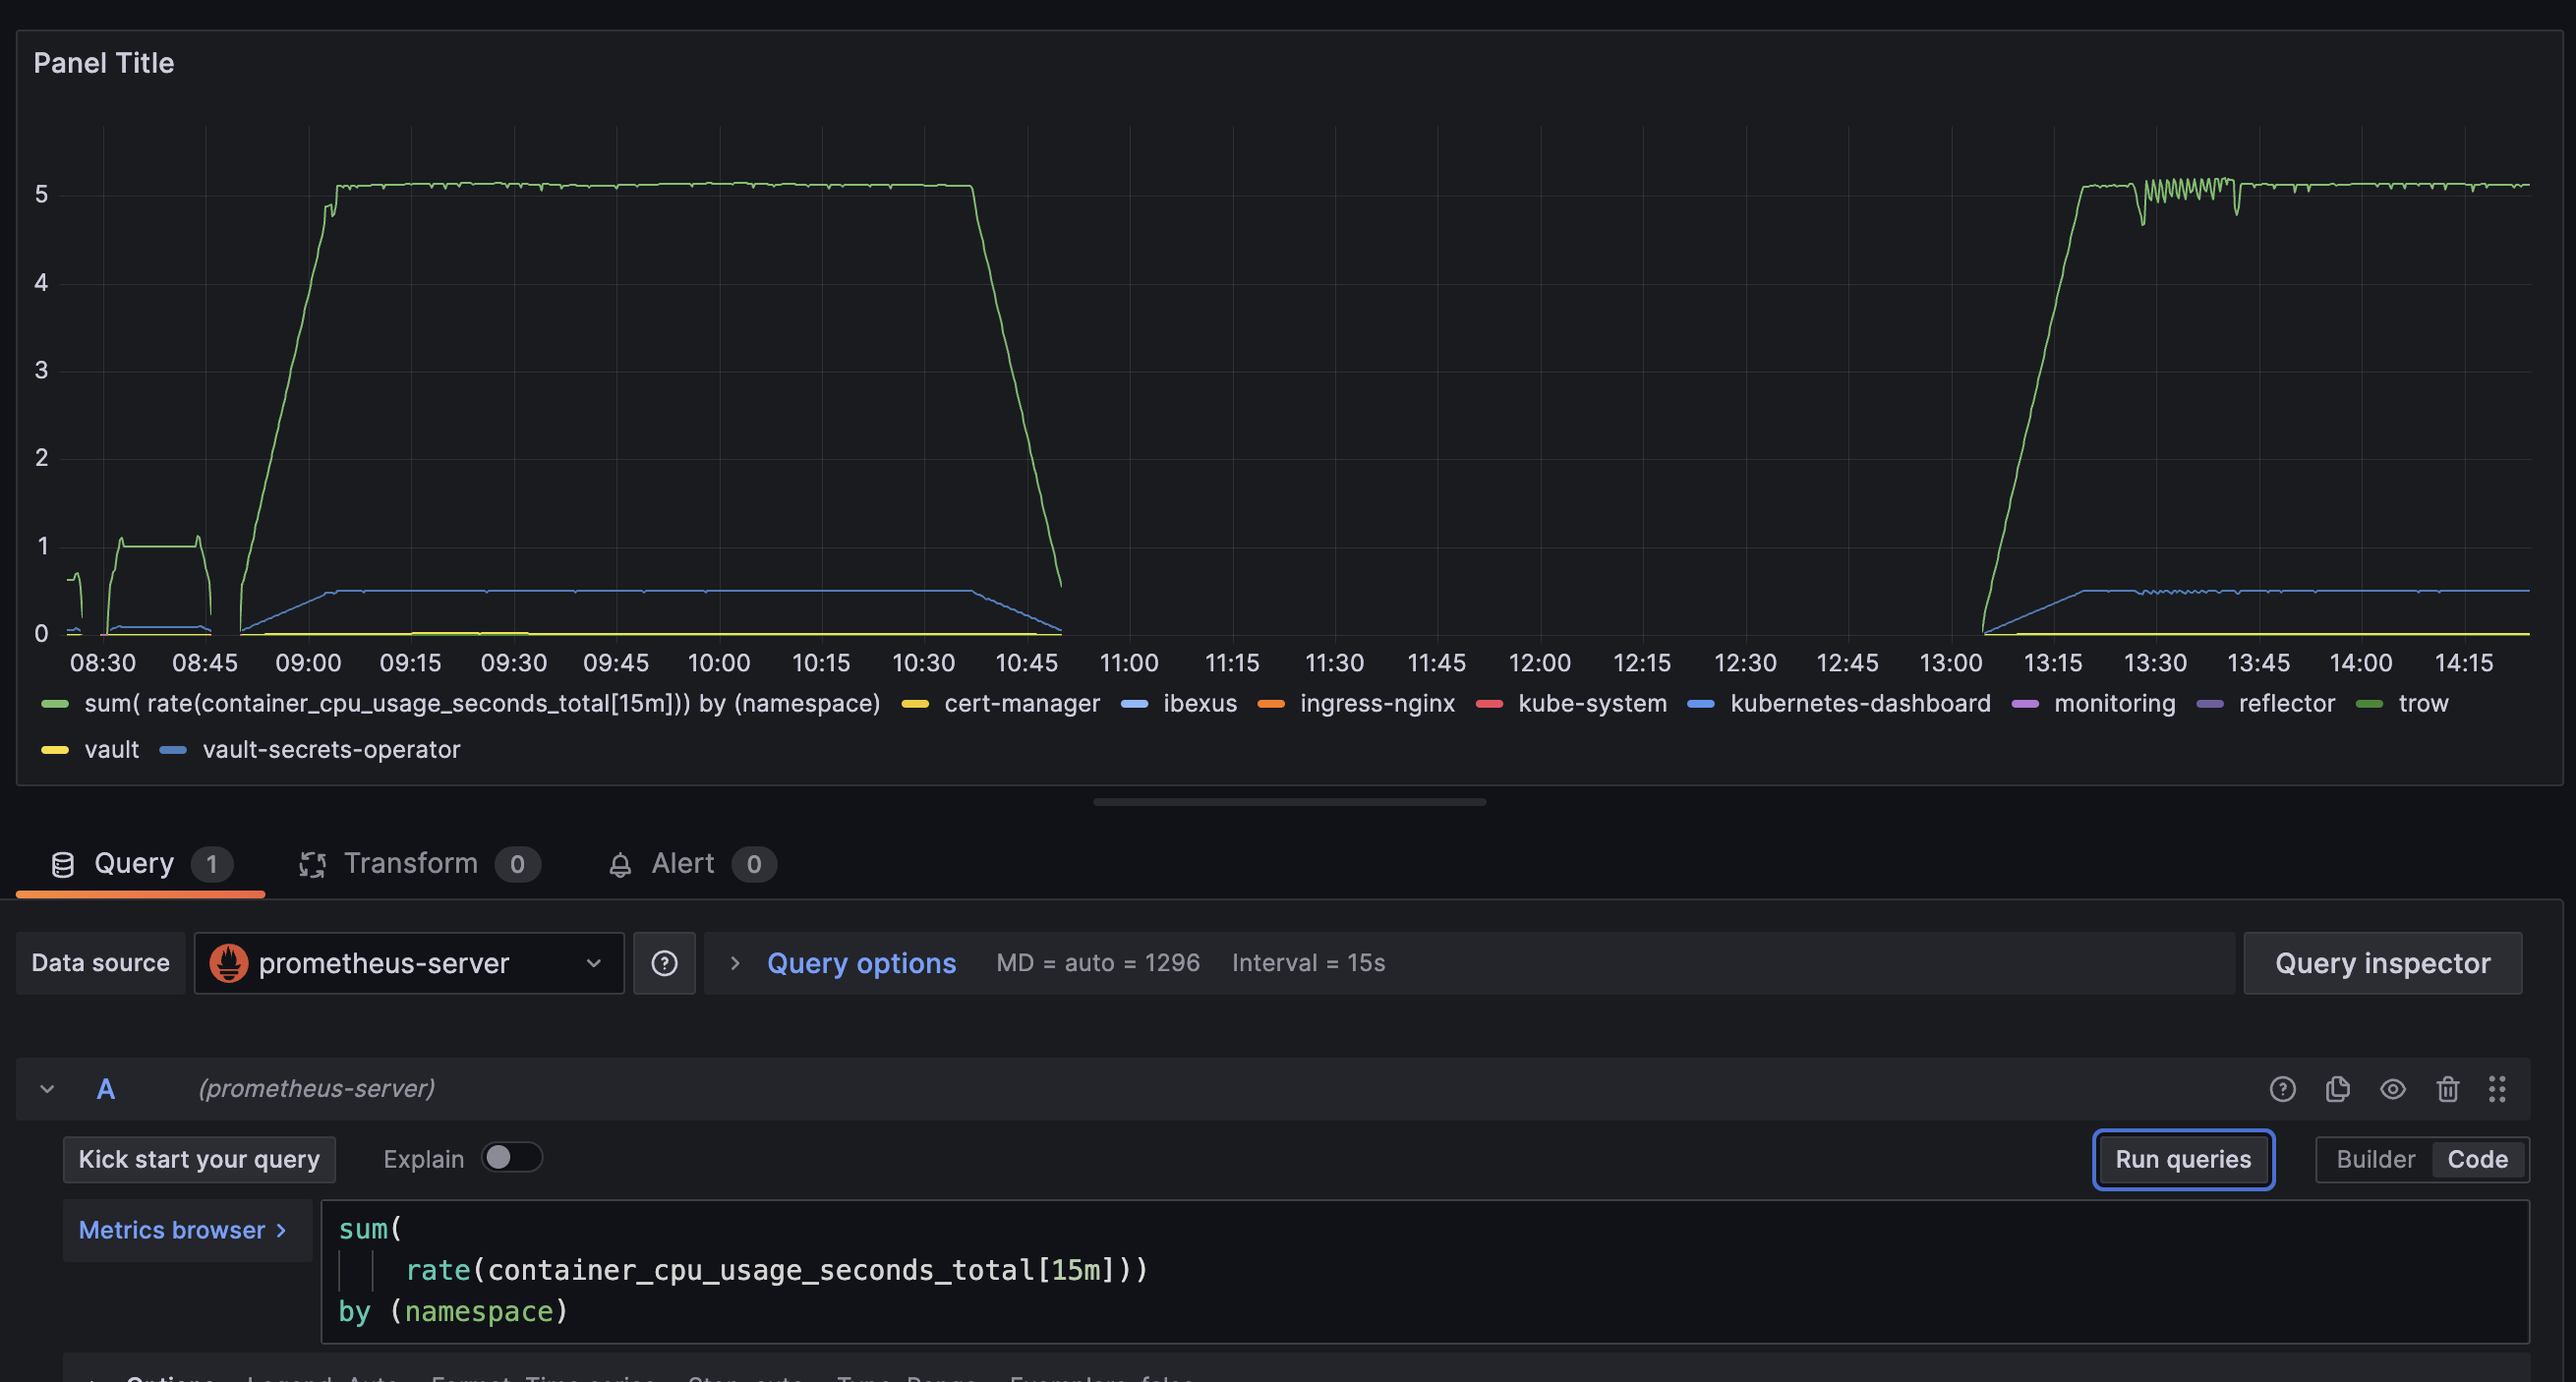
Why is it still showing the total? I only want to have a line per namespace.