I’m trying to display metrics from Opensearch/Elasticsearch. In the old Graph, everything worked as expected but with the new Time Series, the tooltip is strange.
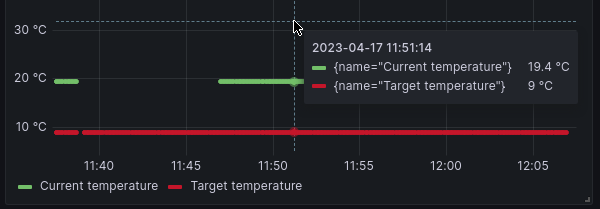
Instead of pure Alias, the {name="Alias"} is displayed.
If there is only one metric, the tooltip name is displayed correctly. In some rare cases, the tooltip will also display correctly in this panel. Wrong tooltip will return after changing e.g. the time range.
I tried this with both Opensearch and Elasticsearch data source with the same result.
Is there some configuration for Time Series panel where I can disable this or is it a bug?
I have exactly the same problem on 9.5.3 after migrating from Graph(old) to TimeSeries. After more investigation I believe I only see it when I have manually edited a provisioned graph though:
with one metric, tooltip displays correctly all the time
Make the provisioned dashboard editable, then edit the panel. Click save (available even though no changes made) and then apply and then you see the {name="Alias"} form back in the dashboard view.
I exported the panel JSON before and after the save and there was no difference…
Trying to reproduce another way…I don’t see the problem when creating a test TimeSeries panel from Grafana Random walks with multiple queries.
My underlying query is of the form:
 SELECT
    t, ID, sum(cnt)/(300 * (1 + intDiv(7200 - 1, 300))) AS qc
  FROM
  (
    SELECT
      (intDiv(toUInt32(DateTime), 7200) * 7200) * 1000 AS t,
      ID,
      sum(Count) AS cnt
    FROM db1.table1
    WHERE Date >= toDate(1679378699) AND Date <= toDate(1679953996) AND DateTime >= toDateTime(1679378699) AND DateTime <= toDateTime(1679953996)
    GROUP BY t, ID
    ORDER BY t, ID
  )
  GROUP BY t, ID
  ORDER BY t, ID