Hi, I’m on last Grafana 9.3.1 with loki and promtail 2.7.1.
I got a strange error “too many outstanding requests”.Datasource proxy returning "too many outstanding requests" · Issue #4613 · grafana/loki · GitHub but I would like to know if it’s something related to the old release or is actual on 2.7.1.
my config file (I’ve added last 5 rows after this post)
auth_enabled: false

server:
  http_listen_port: 3100
  grpc_listen_port: 9096

common:
  path_prefix: /tmp/loki
  storage:
    filesystem:
      chunks_directory: /tmp/loki/chunks
      rules_directory: /tmp/loki/rules
  replication_factor: 1
  ring:
    instance_addr: 127.0.0.1
    kvstore:
      store: inmemory

schema_config:
  configs:
    - from: 2020-10-24
      store: boltdb-shipper
      object_store: filesystem
      schema: v11
      index:
        prefix: index_
        period: 24h

ruler:
  alertmanager_url: http://localhost:9093

# just entered this 5 row below
query_scheduler:
  max_outstanding_requests_per_tenant: 2048

query_range:
  parallelise_shardable_queries: false
  split_queries_by_interval: 0
Thank ALEN
How is it possible?
I start to get serious dubs about LOKI usage…
I have the same issue. My data will come through and then it goes away with this error then comes back for a little bit then goes away again. Hopefully you can find a fix.
jdruiz
August 18, 2023, 9:40am
4
Did anyone solve this scenario?
I’m experiencing the same situation but using grafana/loki:2.8.2 Docker image version.
I am not sure if the OP is still around, but since you are the most recent replies, perhaps we can take a look at your issue. Do you mind sharing your configuration?
jdruiz
August 22, 2023, 10:46am
6
I can share mine if you want.
What info is most valuable?
As I said, in my scenario Loki runs as Docker container. The version is 2.8.2 and my config file is:
auth_enabled: false

server:
  http_listen_port: 3100
  grpc_listen_port: 9096

common:
  instance_addr: 127.0.0.1
  path_prefix: /tmp/loki
  storage:
    filesystem:
      chunks_directory: /tmp/loki/chunks
      rules_directory: /tmp/loki/rules
  replication_factor: 1
  ring:
    kvstore:
      store: inmemory

query_range:
  results_cache:
    cache:
      embedded_cache:
        enabled: true
        max_size_mb: 100

schema_config:
  configs:
    - from: 2020-10-24
      store: boltdb-shipper
      object_store: filesystem
      schema: v11
      index:
        prefix: index_
        period: 24h
I just did a quick test using your configuration and I don’t see anything wrong. Here is what I did:
docker network create lokitest

docker run --net lokitest --name=grafana \
    -p 3000:3000 \
    grafana/grafana-oss

docker run --net lokitest --name loki \
    -v /config:/config \
    -p 3100:3100 \
    grafana/loki:2.8.2 -config.file=/config/loki.yml
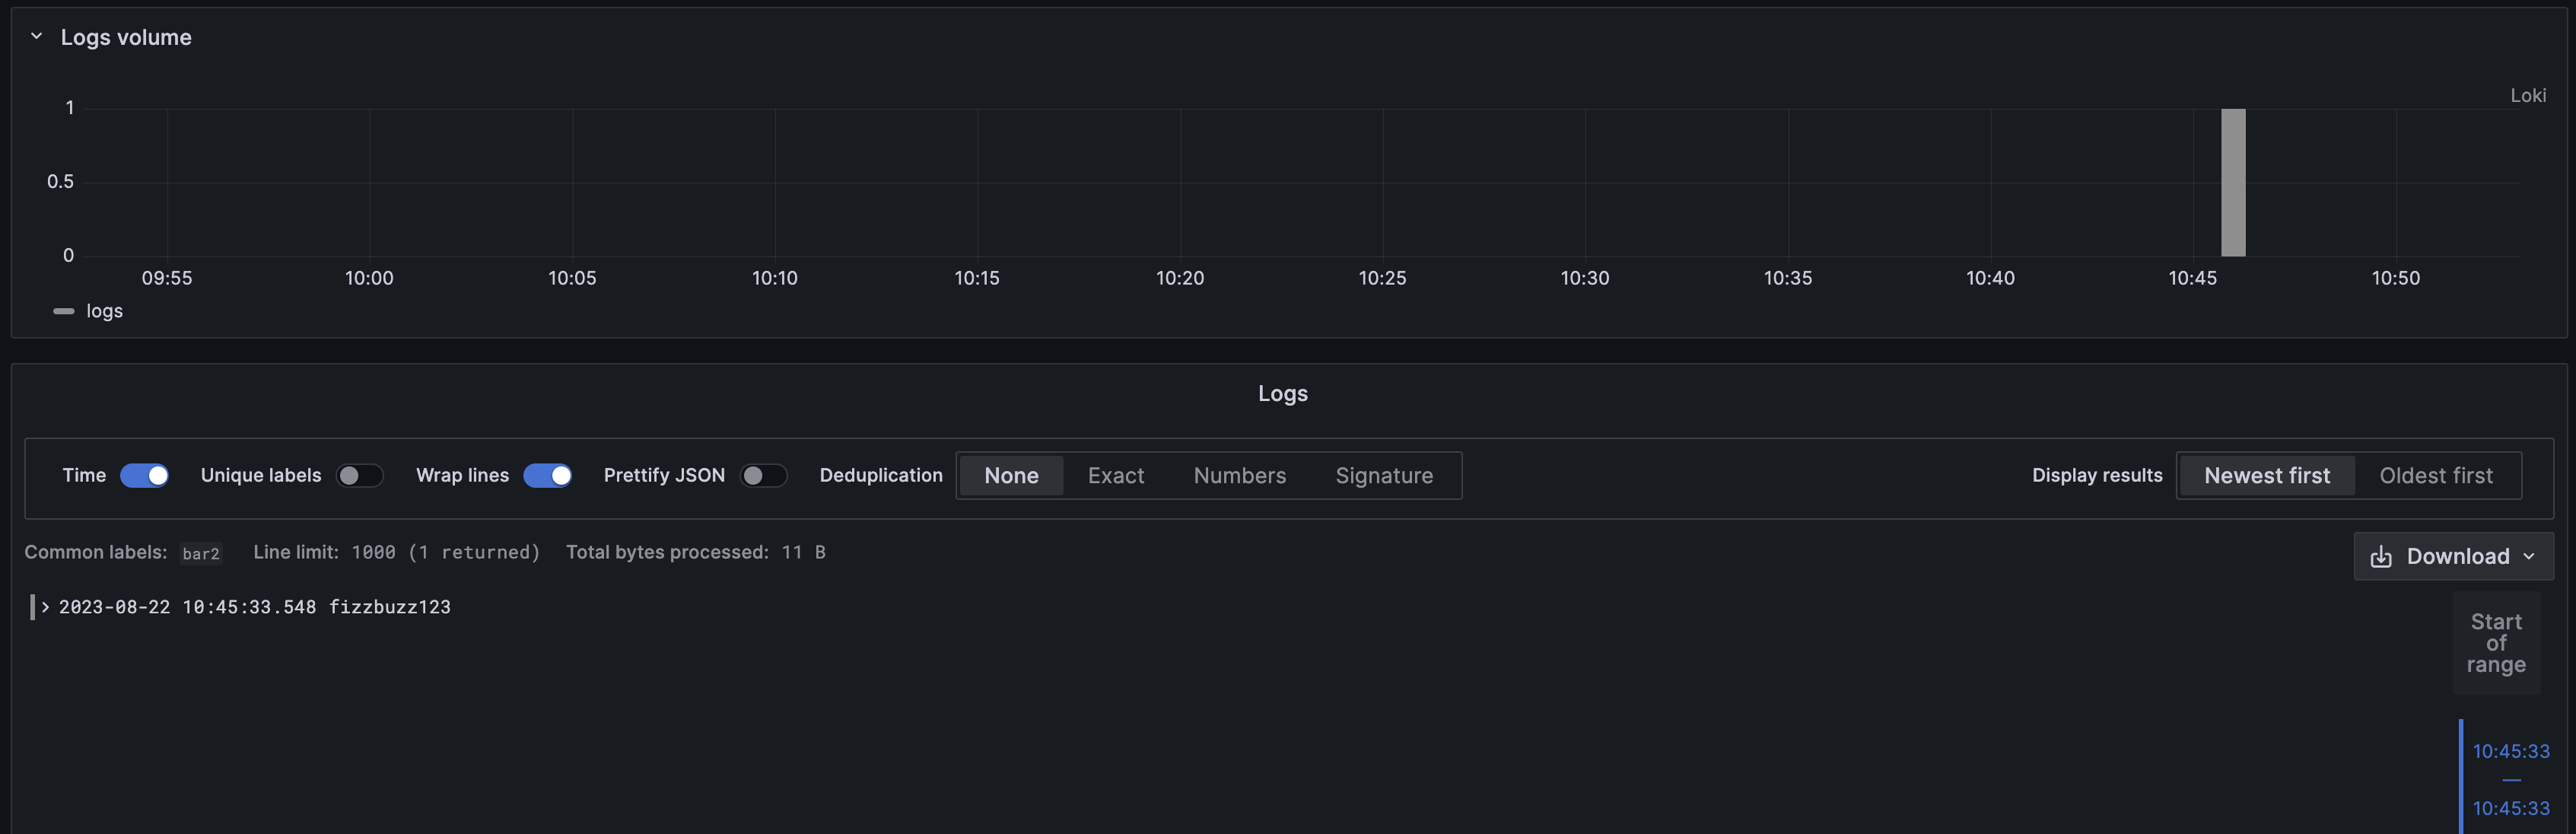
And a quick test:
curl -v -H "Content-Type: application/json" \
  -XPOST \
  -s "http://127.0.0.1:3100/loki/api/v1/push" \
  --data-raw '{"streams": [{ "stream": { "foo": "bar2" }, "values": [ [ "1692726333548968772", "fizzbuzz123" ] ] }]}'
Result:
jdruiz
August 23, 2023, 10:04am
8
Thanks @tonyswumac , I’ll try to expand the description of my issue.
I already shared the current Loki conf, you can see the dashboard that I’ve created below:
The gauges that are visible on the dashboard use the “count_over_time()” function to calculate the number. In all cases, the number represents how many log lines are been found in Loki data source. As you can see, it is working if I use a 5 minutes time range but this is the result if I change the time range to 1 hour:
I think that is relevant to share the LogQL that I use on one of the visualizations:
count_over_time({hostname=~"api01|api02"} |= `MONITOR` |= `Added subtitle` |~ `$canal` [15m])
As you can see, the count_over_time function uses a 15m fix range, so, when I change the dashboard time range, I assume that it affects the embedded graph but it shouldn’t impact the gauge calculation. Anyway, the dashboard is useless if you pick a time range bigger than 15 minutes because most of the visualizations show the warning “too many outstanding requests”.
I hope this help to understand the problem. Of course, maybe I’m using badly the Grafana/Grafana Loki capabilities and I should improve the way I configure the dashboard.
You obviously have a bottleneck somewhere. Some things to check:
What’s the average size of chunk files? How many chunk files do you have say for a 30-minute window?
What does your ulimit look like?
If you are running a single instance, best not to split query, Try setting split_queries_by_interval to 24h or 0 to disable it.
Check logs and system metrics and see if you can find anything obviously wrong.
jdruiz
August 25, 2023, 7:43am
10
Thanks a lot for your time, @tonyswumac .
My answers:
For the last 36 minutes, I can count 15 chunk files. Taking all these files together sums 7866718 bytes and the average is 524448.
In fact, I can share my terminal output:
/tmp/loki/chunks $ ls -lrth | grep "25 09:" ; ls -lrth | grep "25 09:" | wc -l ; ls -l | grep "25 09:"| awk '{ sum += $5 } END { print "Total size:", sum, "Avg size:", sum/NR }'
-rw-r--r--    1 loki     loki      502.4K Aug 25 09:00 ZmFrZS9lMThkMDM1ZWFlYTg4OTE5OjE4YTJiMTAzNTNlOjE4YTJiN2U1NjU1OmYwMzVlYzU1
-rw-r--r--    1 loki     loki      551.4K Aug 25 09:08 ZmFrZS9lMjdiYzhmNmQxZTUxZGFlOjE4YTJiMTc2YTYzOjE4YTJiODU5Y2FhOmU3MWNlNjU=
-rw-r--r--    1 loki     loki      428.7K Aug 25 09:08 ZmFrZS9jNmNhZTNkZjkzMWI2YzdmOjE4YTJiMTc2ZWJhOjE4YTJiODViNDk1OjMwMzI0ODdi
-rw-r--r--    1 loki     loki      265.6K Aug 25 09:09 ZmFrZS9jZGRiYzZhMGY1NjU5MjQ3OjE4YTJiMTg1ODI5OjE4YTJiODY5ZjE4OmE4NmQ4ODFk
-rw-r--r--    1 loki     loki      762.2K Aug 25 09:09 ZmFrZS8xYTgxMzk3ZjgzMmZjNjNmOjE4YTJiMTg1YzEyOjE4YTJiODZhMzAzOmZiYzg5M2Y1
-rw-r--r--    1 loki     loki      658.3K Aug 25 09:13 ZmFrZS81NGUxZmUwN2IwNzM0YTkzOjE4YTJiMWM4ZmEwOjE4YTJiOGFiYjIxOjc0ZmUxNWUy
-rw-r--r--    1 loki     loki      608.9K Aug 25 09:16 ZmFrZS81MWI3YzA5MmI5N2JhZGI1OjE4YTJiMWY2NmEyOjE4YTJiOGQ3YWExOjY5OWFiNmU=
-rw-r--r--    1 loki     loki        2.1K Aug 25 09:18 ZmFrZS80MDkzNjQxOWZlNzYwMWEwOjE4YTJiMjAyNmVkOjE4YTJiOGVlYTc2OjJkNWE3OWUw
-rw-r--r--    1 loki     loki      556.0K Aug 25 09:19 ZmFrZS80NjE1OGJlYmJjNWFmZDJlOjE4YTJiMjE4MGE4OjE4YTJiOGZjYzUxOmJkYmQ5ZDY3
-rw-r--r--    1 loki     loki        1.3M Aug 25 09:21 ZmFrZS9mN2EwNzA5MGYxNWQ4YzAzOjE4YTJiNWM2OWFkOjE4YTJiOTFkYjIyOjU5ZjY1Y2Q=
-rw-r--r--    1 loki     loki        1.3M Aug 25 09:22 ZmFrZS9lNDBjNTNmYjc3N2YwNTBiOjE4YTJiMmIxYTA0OjE4YTJiOTIyZWRjOjkxYTk2Nzc4
-rw-r--r--    1 loki     loki      300.8K Aug 25 09:26 ZmFrZS82MzdhYmQ5YTc5MDEwYmQzOjE4YTJiMjg2NzQxOjE4YTJiOTZhMDhlOjE2MDAxZWU1
-rw-r--r--    1 loki     loki        3.2K Aug 25 09:32 ZmFrZS8xODg4MzU3ZGUzNmU5YmEzOjE4YTJiMWRkOTgwOjE4YTJiOWI3N2Y2OmU1OWRhZjA1
-rw-r--r--    1 loki     loki        7.7K Aug 25 09:33 ZmFrZS9jYjczNzgzMDI1ZTc5ZjJiOjE4YTJiMmU1MDY4OjE4YTJiOWM1M2MxOjc5ZTIwNTk=
-rw-r--r--    1 loki     loki      354.2K Aug 25 09:33 ZmFrZS9iYzY0ZDhiMzFjNDJhYmZjOjE4YTJiMmVjMjVjOjE4YTJiOWQwYzE5OjVhZGI0MjE3
15
Total size: 7866718 Avg Size: 524448
The ulimit configuration looks like this:
/tmp/loki/chunks $ ulimit -a
core file size (blocks)         (-c) unlimited
data seg size (kb)              (-d) unlimited
scheduling priority             (-e) 0
file size (blocks)              (-f) unlimited
pending signals                 (-i) 127469
max locked memory (kb)          (-l) 64
max memory size (kb)            (-m) unlimited
open files                      (-n) 1048576
POSIX message queues (bytes)    (-q) 819200
real-time priority              (-r) 0
stack size (kb)                 (-s) 8192
cpu time (seconds)              (-t) unlimited
max user processes              (-u) unlimited
virtual memory (kb)             (-v) unlimited
file locks                      (-x) unlimited
Not much to say. I’ll change the split_queries_by_interval value because right now its value is the default which means 30m.
If I find anything relevant in the system logs I’ll share it too.
jdruiz
August 25, 2023, 12:54pm
11
Hi again,
I’ve followed your recommendations and it seems that my problems have disappeared. Here are the details:
auth_enabled: false

server:
  http_listen_port: 3100
  grpc_listen_port: 9096

common:
  instance_addr: 127.0.0.1
  path_prefix: /tmp/loki
  storage:
    filesystem:
      chunks_directory: /tmp/loki/chunks
      rules_directory: /tmp/loki/rules
  replication_factor: 1
  ring:
    kvstore:
      store: inmemory

query_range:
  results_cache:
    cache:
      embedded_cache:
        enabled: true
        max_size_mb: 500

chunk_store_config:
  max_look_back_period: 0s
  chunk_cache_config:
    embedded_cache:
      enabled: true
      max_size_mb: 500
      ttl: 24h

schema_config:
  configs:
    - from: 2020-10-24
      store: boltdb-shipper
      object_store: filesystem
      schema: v11
      index:
        prefix: index_
        period: 24h

limits_config:
  split_queries_by_interval: 0
After those changes, I’ve tried to reproduce the same problematic scenario but my current Loki log is clean and the Grafana dashboard replies fast and without errors. I just want to share my experience, maybe someone could get ideas and improve their own scenario.
Thanks again for your time and answers, @tonyswumac
No problem. If you are going to run a single node long term, you may also consider tweaking the chunk settings a bit more, specifically increasing chunk_target_size, max_chunk_age, and chunk_idle_period so that you get bigger but fewer chunk files. With a single node setup you would be less likely to run into limitations, especially when querying for a bigger time window.
Of course, if you do decide to increase the time that chunks could stay in memory, be sure to increase query_ingesters_within as well.
glcnwl
February 29, 2024, 2:47pm
13
Thx mate, you saved my day !