-
We are using grafana v9.0.0 and Ubuntu 20.04.4.
-
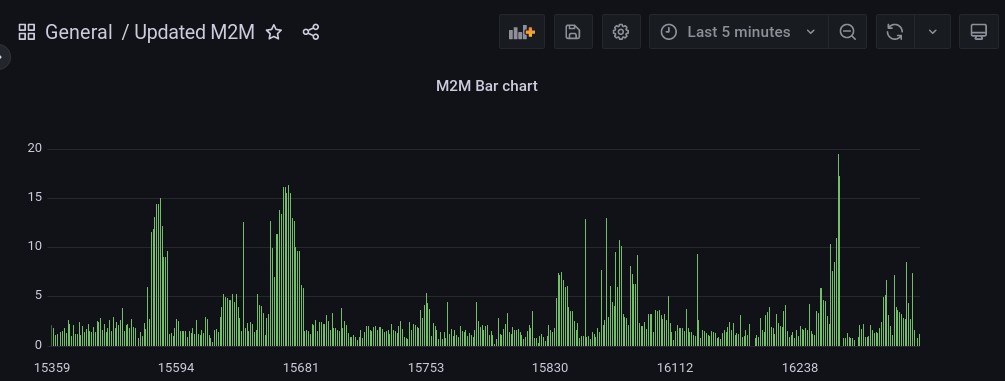
**We are trying to utilize time range selector to filter in bar-chart and bar-gauge.
-
**Trying to change the time range, for example from past 24 hours to past 1 month etc.
-
No change in data and representation of that data in bar-graph and bar-gauge.
-
Expected for the change in visualization in the bar-graph when changing the time range.
Please let me know a way to achieve this.
Attached the screenshots for the reference.

Please provide the data source details and the query
This is the schema which we are using,

The query is given below.
** **SELECT ** lastupdated as time_sec, ** TIME_FORMAT(sec_to_time(time), "%H:%i") AS total_time, ** mrid as metric ** ,time/3600 as time_in_hours **FROM margetomerge.mergedetails order by lastupdated **
This is the table view in grafana.

Please post data as useable csv and not an image
Not able to upload .csv files in this forum.
we can download csv file through this link
Hello ,
you forget yo use time range in your query.
If you want the time range button to filter by date you have to use it in your query.