Hello,
I need to show time line graph for different ranges (15m, 1h, 1d, 10d)
I understand that grafana internally calculates value for the auto based on the selected range.
But these auto values are really small. If i specify the min auto (in datasource config) to be 1m, this 1m value is used for 15m, 1h and 1d intervals, which results in too many datapoints.
Can i somehow override the default calculation for auto? In the example above, i would like 1m to be used for 15m and 1h ranges, and 1h interval used for 1d and 10d ranges.
Thanks, but it doesn’t work for me.
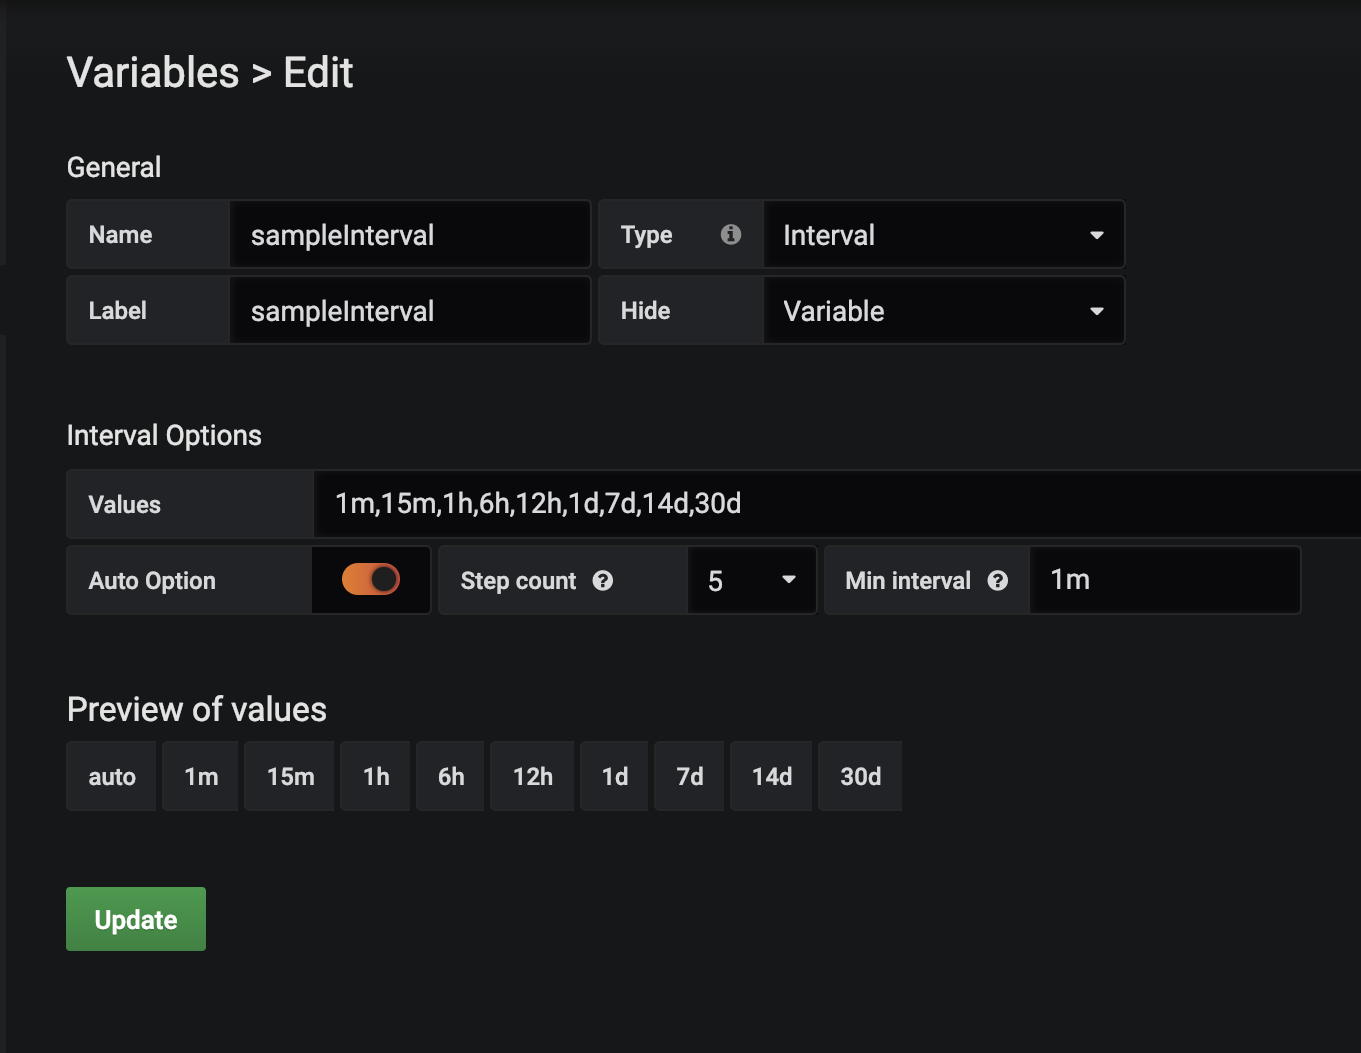
I declared a variable of type Interval and named it sampleInterval.
Specified auto option in variable declaration, choose step count, but nothing changes when I choose auto option in date histogram.
The same value 1m is used for 15, 1h and 1d range.
Another question, what if I have 2 variables of type interval (lets say one for range, so I can change 15m, 1h, 1d, 10d) from select box and the other one for aggregation (date histogram).
Then if I specify auto, which one will be taken 1st or the 2nd one?
Then I changed panel time range to be 1d and here is what query inspector shows.
It is still 1m. What should I do to make it for example 15m or 30m for 1d range?
{"size":0,"query":{"bool":{"filter":[{"range":{"timestamp":{"gte":"1548943600586","lte":"1549030000586","format":"epoch_millis"}}},{"query_string":{"analyze_wildcard":true,"query":"name:(\"X\") AND level:(\"A\" OR \"B\" OR \"C\")"}}]}},"aggs":{"6":{"terms":{"field":"status","size":10,"order":{"_key":"desc"},"min_doc_count":1},"aggs":{"5":{"date_histogram":{"interval":"**1m**","field":"timestamp","min_doc_count":1,"extended_bounds":{"min":"1548943600586","max":"1549030000586"},"format":"epoch_millis"},"aggs":{}}}}}}
I use this technique for almost all my dashboards based on Elasticsearch data sources, since the auto value for interval from the ES plugin almost always results in “too many buckets” for the given time range selected.
If I select auto instead of the $es_interval var, it results in the too many buckets error because the auto interval is too granular. This is especially annoying because using the $es_interval var means that I can no longer alert on the data in the same panel because alerting is not supported for panels that use template vars.
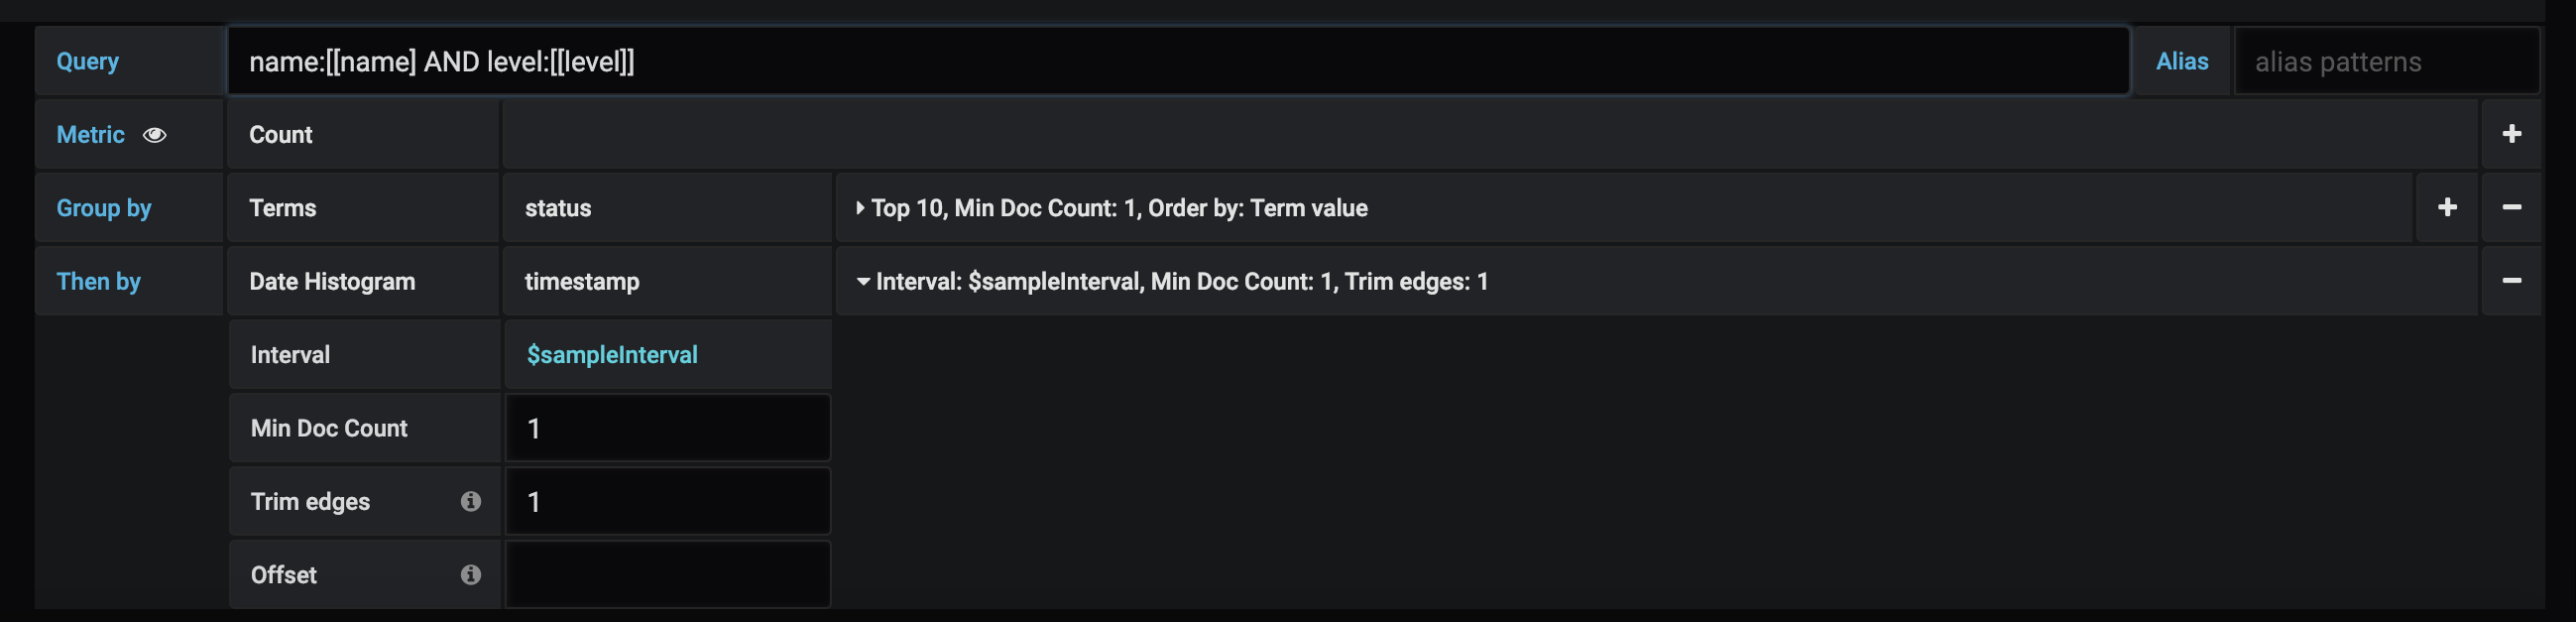
Trying to use this for a simple query like “count the number of occurrences for each time interval”, but the options available for the date histogram apparently did not allow me to select the $interval variable: