Hi there,
I have encountered an issue while querying my Loki instance via Grafana.
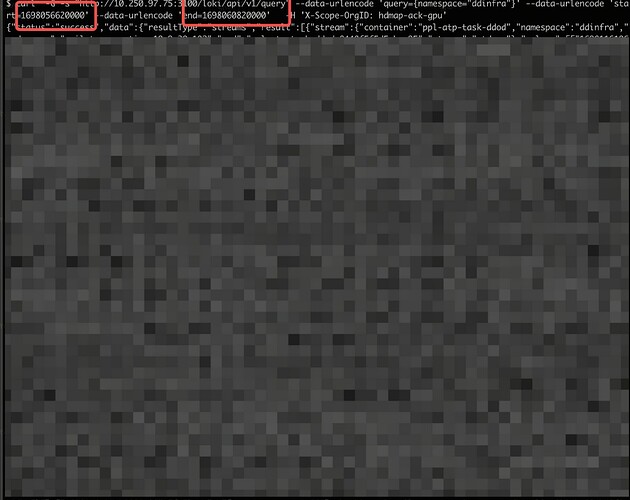
My current set up involves Loki version 2.9.1 and Grafana version 8.3.5. I’m trying to retrieve logs from my Loki instance through Grafana’s explore view but despite setting the same time range as my cURL requests to the /loki/api/v1/query endpoint of the Querier component, I’m not receiving any data in Grafana.
Interestingly, these cURL requests to Loki are successful and return the expected data for exactly the same time range. The datasource in Grafana is configured to use the Querier component’s port 3100.
Here are some screenshots illustrating the issue:
Could someone please help me understand why this might be happening?
Thank you so much for your assistance!


