Hi everyone,
Here’s some background: We have several Java services in a Kubernetes cluster, all of which have OTEL set up. We’re using Tempo to collect traces from these services. From Tempo version 2.4 and above, there’s a feature that creates request graphs, which is super useful. However, I haven’t been able to get the graphs to display properly.
I’m installing Tempo using HelmChart:
Chart: tempo-distributed-1.18.0,
APP VERSION: 2.6.0
I did a default HelmChart installation but made a few small changes to the config:
helm upgrade --install tempo grafana/tempo-distributed --version 1.18.0 -n loki \
--set metricsGenerator.enabled="true" \
--set otlp.http.enabled="true" \
--set grpc.http.enabled="true"
I haven’t set up S3 storage. We have a Prometheus outside the k8s cluster that’s supposed to be receiving metrics from Tempo, and I added it to the target list. All the pods deployed successfully, and I don’t see any errors in the logs.
I set up the following settings when adding the Tempo DataSource:


The traffic from k8s is routed through Ingress:
apiVersion: networking.k8s.io/v1
kind: Ingress
metadata:
  name: tempo-ingress
  namespace: loki
  annotations:
    nginx.ingress.kubernetes.io/rewrite-target: /
    nginx.ingress.kubernetes.io/proxy-body-size: 50m
    nginx.ingress.kubernetes.io/proxy-read-timeout: "600"
    nginx.ingress.kubernetes.io/proxy-send-timeout: "600"
spec:
  ingressClassName: nginx
  rules:
  - host: <DNS_NAME>
    http:
      paths:
      - path: /
        pathType: Prefix
        backend:
          service:
            name: tempo-query-frontend
            port:
              number: 3100
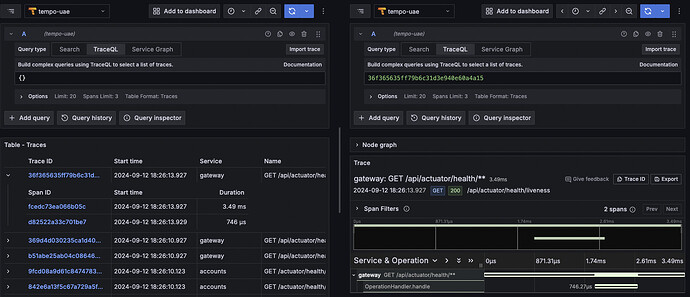
When I simply view the traces using the empty function {}, everything shows up and works perfectly:
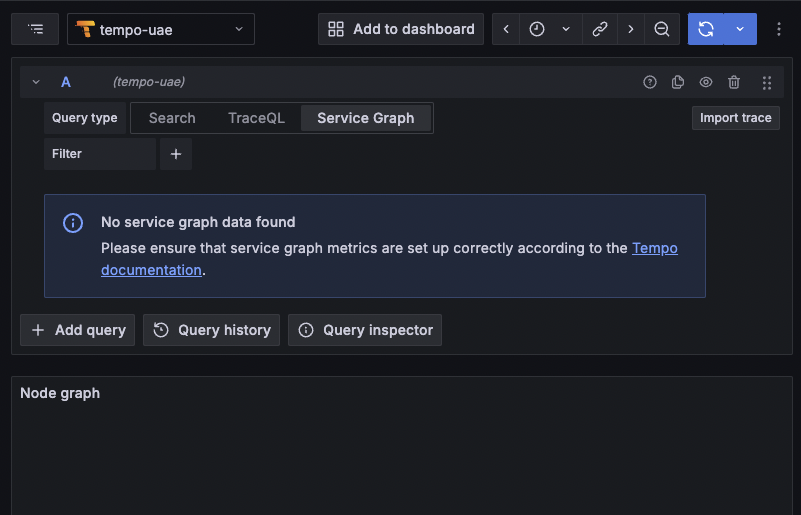
It also displays the Node Graph in each span, but when I switch to the Service Graph tab, it’s empty:
But when I try {} | rate(), nothing shows up. I have no idea why. Maybe I need to change something else in the values.yaml file? Any advice would be helpful, I really want to see the graphs, but I don’t know how to debug this.


