Table time series

Hi all,
Il really need help to achieve a “simple” task.

  • What Grafana version and what operating system are you using?
    V10

  • What are you trying to achieve?
    Transform bar vizualisation into table
    This is a value (sum) by month for each shop …

But I would like to have the same but in table like :

           MONTH01 | MONTH02 | MONTH03 ....

SHOP1 value | value | value
SHOP2 value | value | value

My data source is like that :

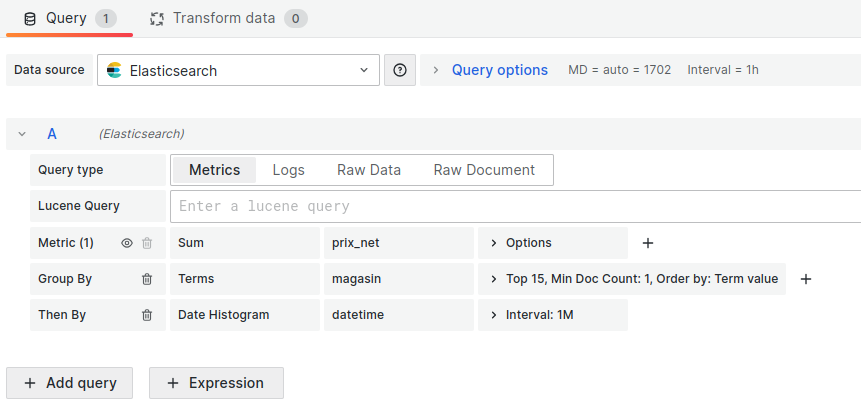
could you please help ?

Thanks a lot.

Guillaume

So you want the table to show in the graph as well?

image

Hi,
Thanks but in fact I just want a table (no graph).

You can use this at the top:

image

Or switch your visual to table:

if I choose table (or table view) … I have only one shop (web here) with a combobox at the bottom

I really need the data like

image

What query are you performing?

magasin means “shop”
prix_net means “amount”

Does it work when you only use Group By magasin and not date?

try out transformation, group by matrix

What you are looking for is pivot

Dear All,
none of the option was OK but I changed my datasource to mysql, much easier.
Thanks a lot