I want to understand how to create simple tables and dashboard with grafana connected to mysql.
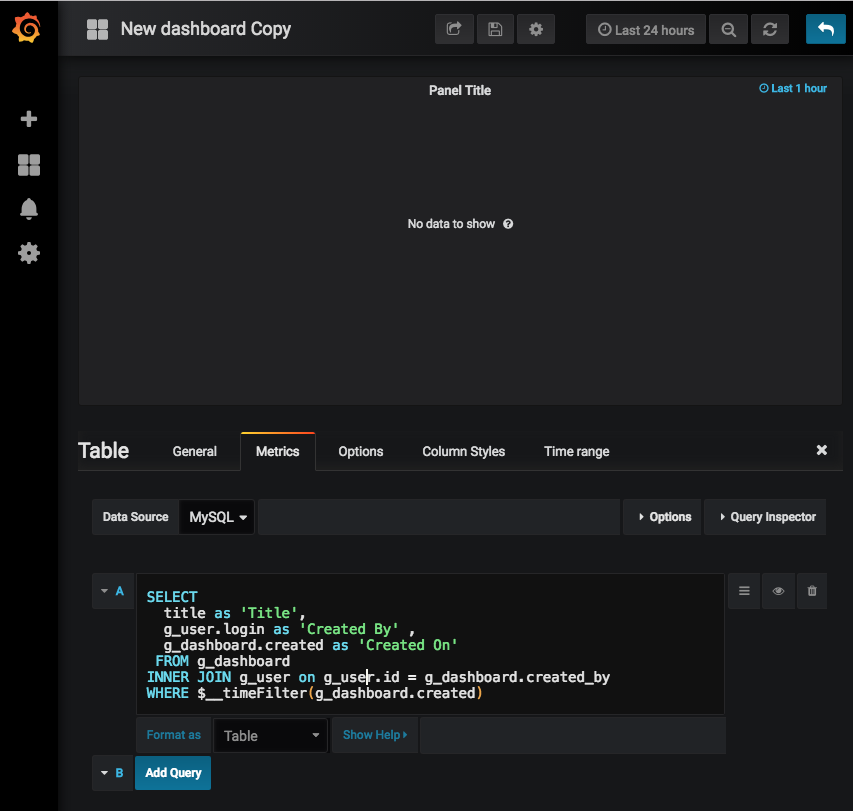
I followed an example, as in the screenshots.
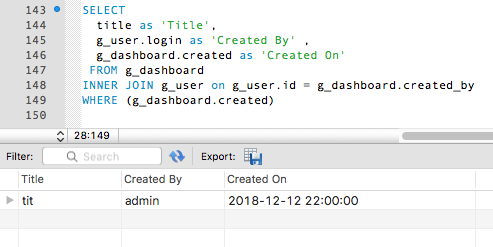
I’ve created a db for the example, the query is working in mysql, I inserted the query in the table sql editor, but nothing is showing.
The datasource was saved correctly, I don’t see any error
It should be something really stupid but I’m stuck.