Hi All,
- Grafana v.9.3.6
- PostrgreSQL v14.3
I have this dataset:

I’d like to have a single graph that groups the “label_name” records together and displays each “label_name” as its own independent line on the graph.
Using the query below, I can get Grafana to display the data using the “Table view”, but when trying to visualize it as a line graph it shows up as just one line, see below. Thanks in advanced
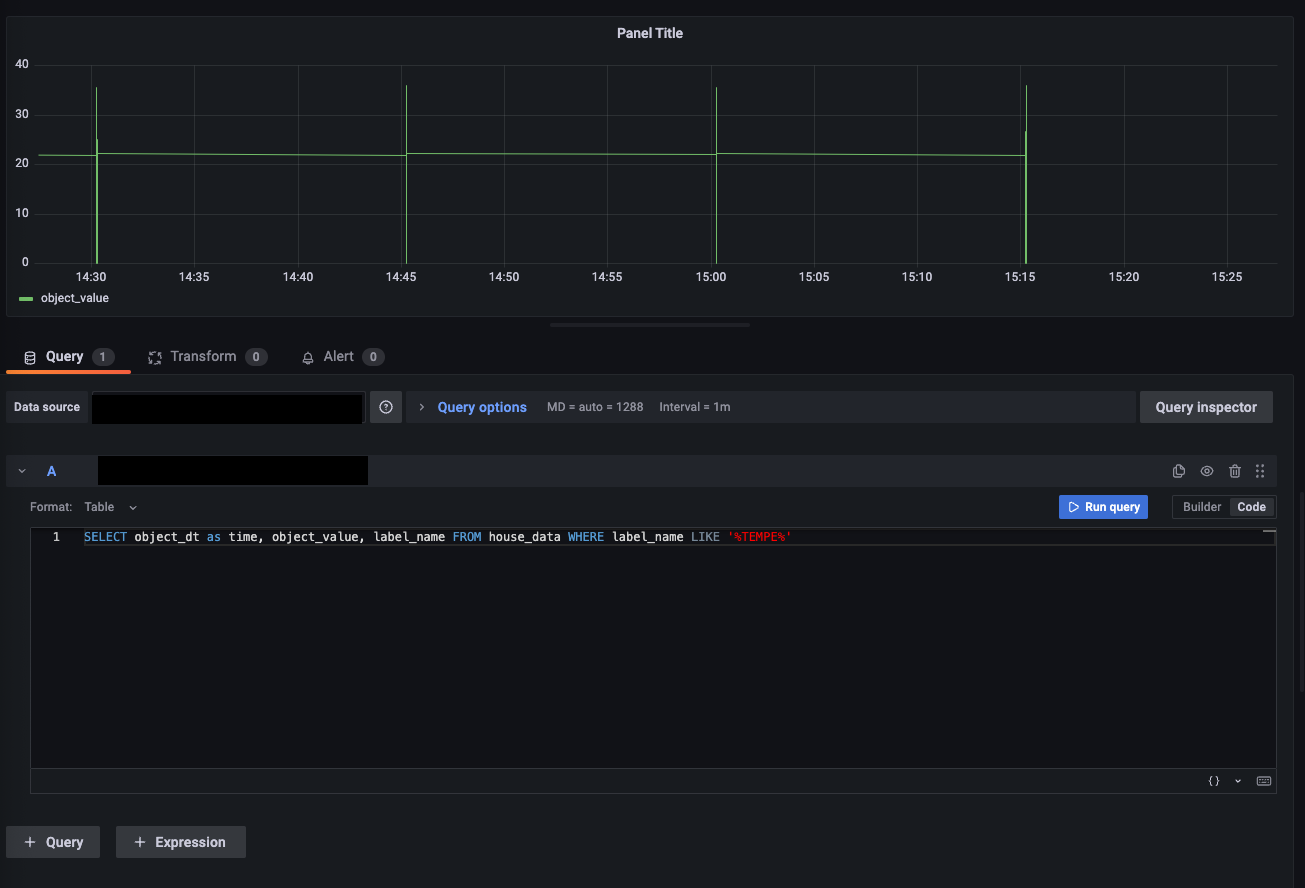
SELECT object_dt as time, object_value, label_name FROM house_data WHERE label_name LIKE ‘%TEMPE%’