-
What Grafana version and what operating system are you using?
→ 10.0.3 -
What are you trying to achieve?
Custom written SQL -
How are you trying to achieve it?
→ Develped by HeidiSQL and transfered to Grafana -
What happened?
Error -
What did you expect to happen?
single value -
Can you copy/paste the configuration(s) that you are having problems with?
→ witch one? -
Did you receive any errors in the Grafana UI or in related logs? If so, please tell us exactly what they were.
logger=tsdb.mysql t=2023-10-06T10:05:25.957937279+02:00 level=error msg=“Query error” error=“Error 1046: No database selected”
logger=context userId=6 orgId=1 uname=axel t=2023-10-06T10:05:25.958116495+02:00 level=info msg=“Request Completed” method=POST path=/api/ds/query status=400 remote_addr=192.168.12.127 time_ms=2 duration=2.299914ms size=771 referer="htt> -
Did you follow any online instructions? If so, what is the URL?
No.
Details:
I use ioBroker-Database (MariaDB) with HeidiSPQ-Workplace and Grafana SQL-Connection to analyse data. All instances are local. MariaDB an HeidiSQL running on dedicated local servers aswell ioBroker.
Table ts_numers is organised as and collects realtime data:
id int len 11 not nil /* device /
ts bigint len 20 not nil / 1/1000 of ticks /
val double / measurement /
ack tinyint len 1 / internal /
_from int len 11 / internal /
q int len 11 / internal */
In some cases I need to subtract val with different time bases, e.g. by day, by mounth or by year. So I defvelopt the followin SQL:
SELECT
FROM_UNIXTIME (t1.ts/1000),
FROM_UNIXTIME (t2.ts/1000),
t1.val,
t2.val,
t2.val - t1.val
from ts_number t1 left JOIN ts_number t2 ON t1.id = t2.id
where t1.id = 5538 AND t1.val>0
and t1.ts BETWEEN (UNIX_TIMESTAMP(‘2023-09-01 00:00:00’)*1000) and (UNIX_TIMESTAMP(‘2023-09-01 00:10:00’)*1000)
AND t2.ts BETWEEN (UNIX_TIMESTAMP(‘2023-10-01 00:00:00’)*1000) and (UNIX_TIMESTAMP(‘2023-10-01 00:10:00’)*1000)
LIMIT 100;
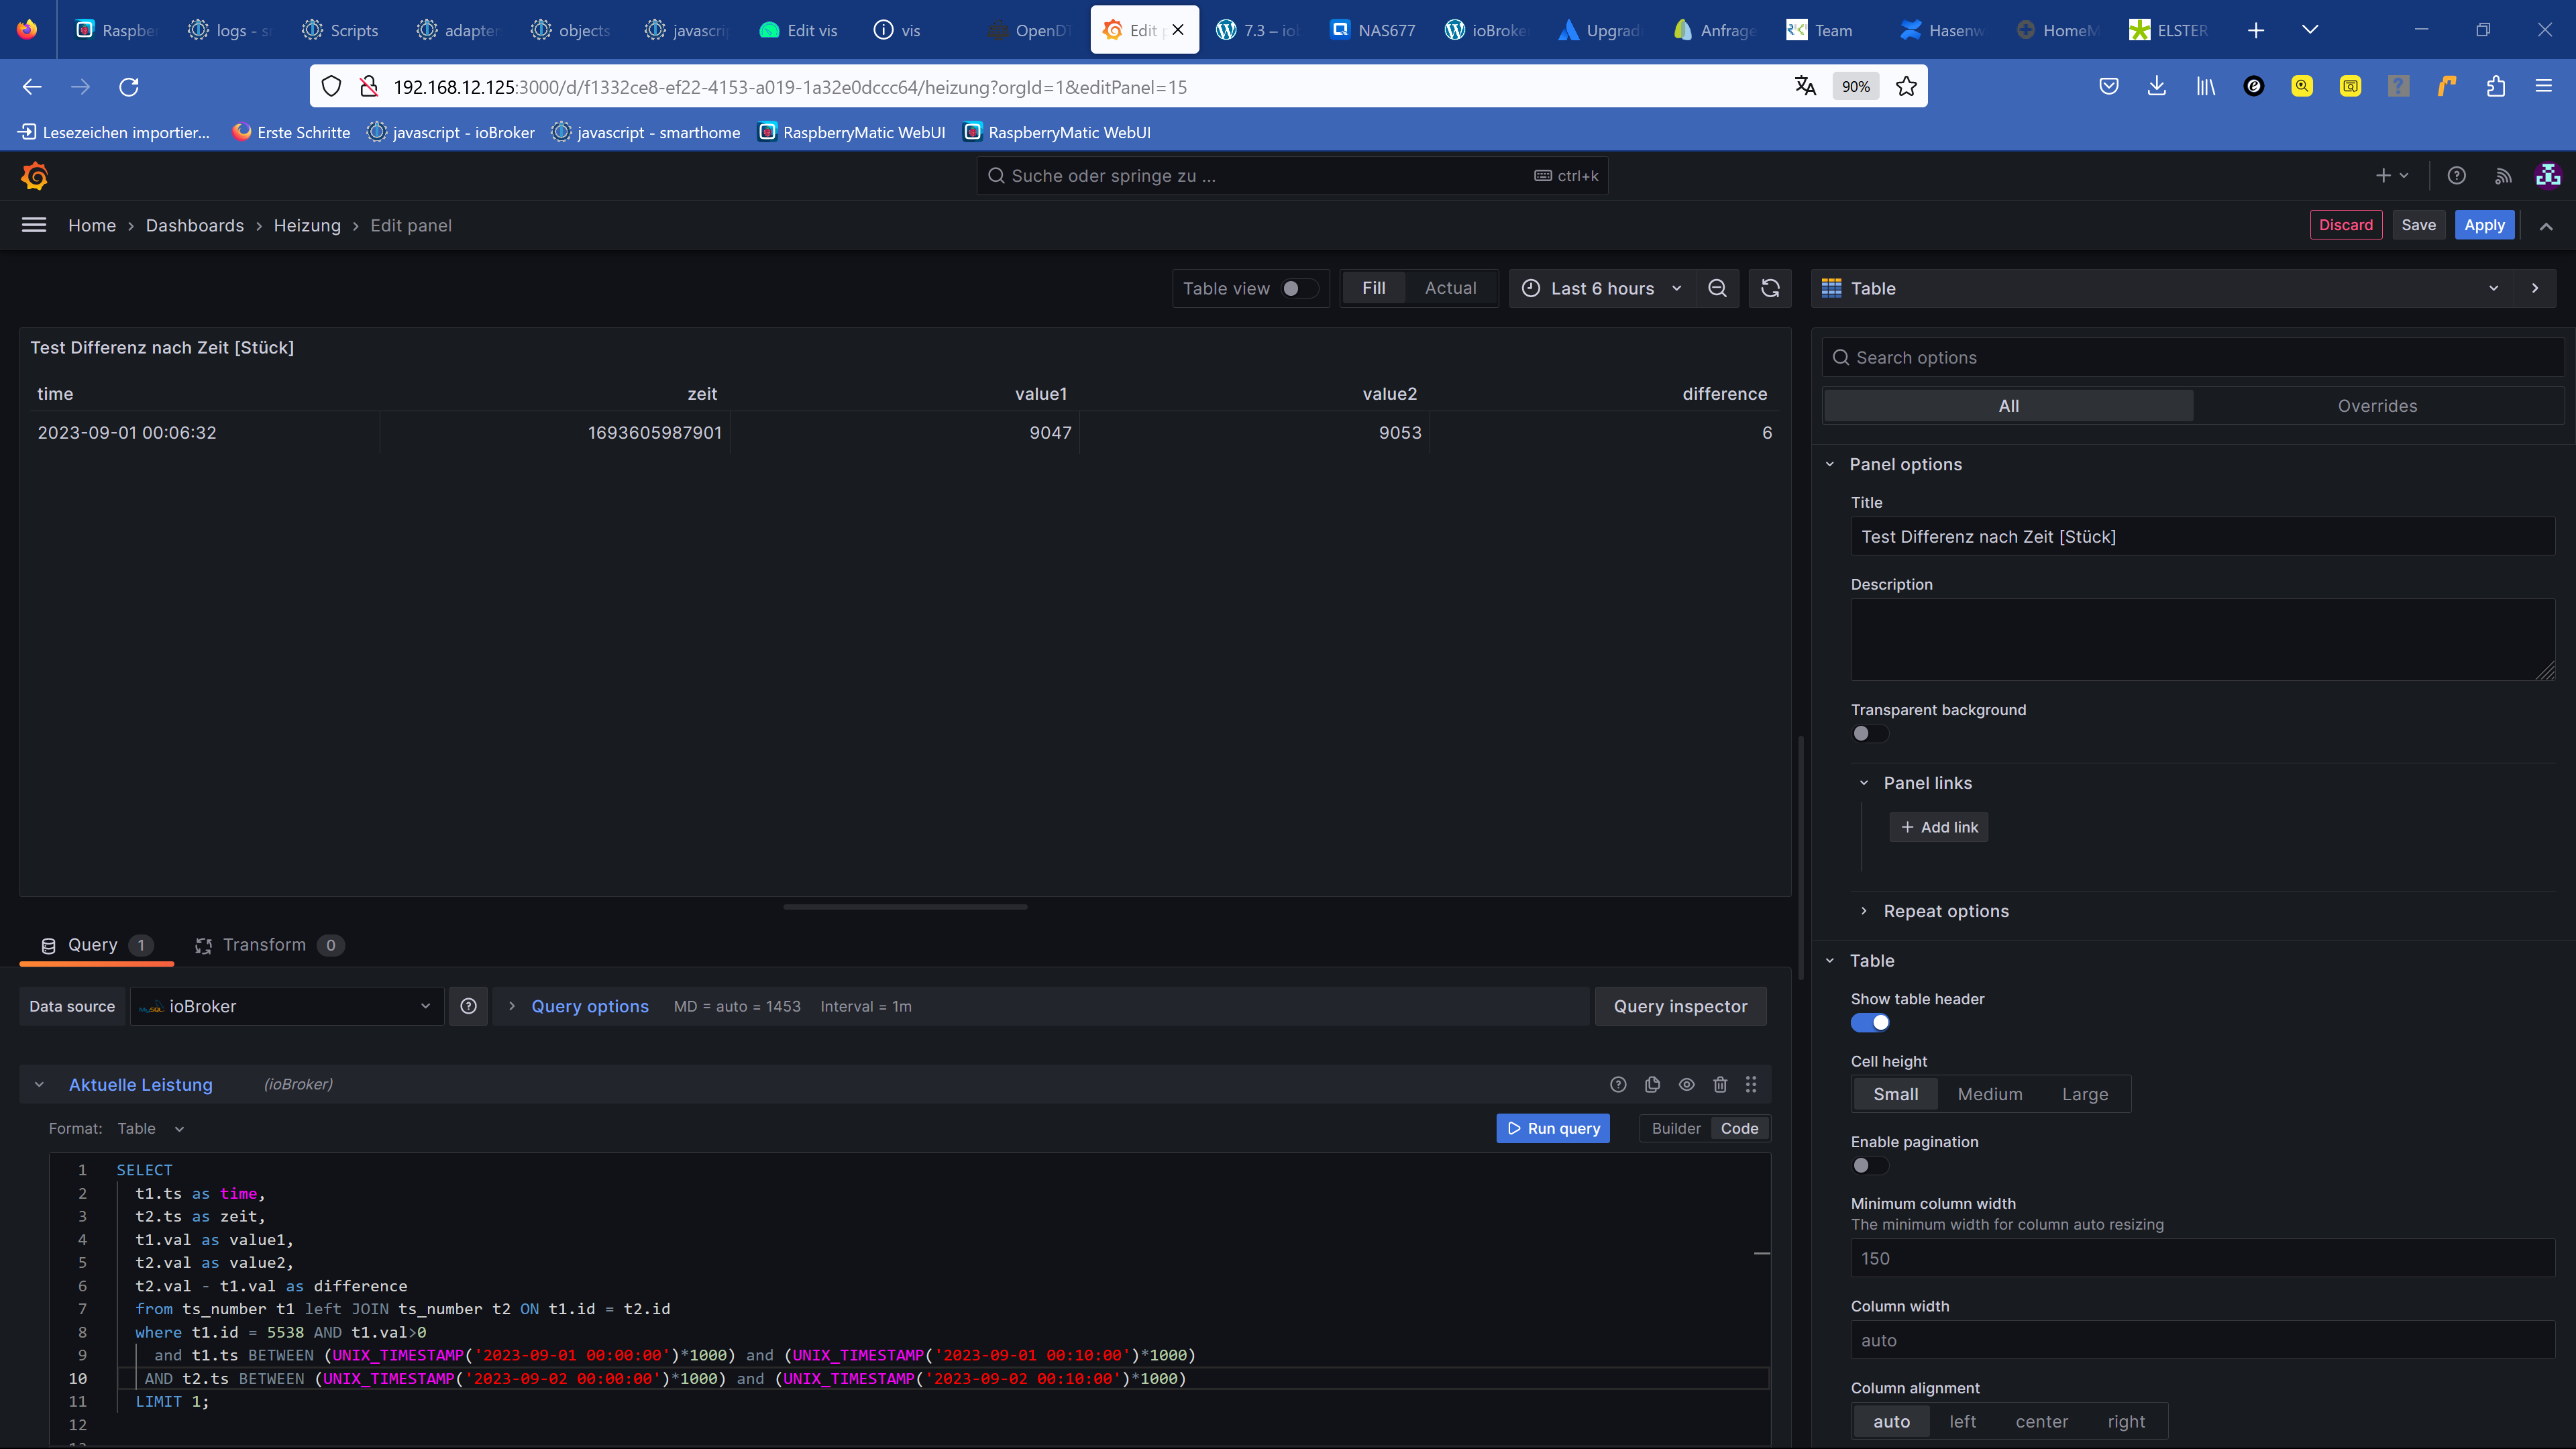
With HeidiSQL I get the expectes result.
t1.ts t2.ts t1.val t2.val difference
2023-09-01 00:06:32.0770 2023-10-01 00:03:57.1810 9047 9223 176
Now copied the code to grafana, the above error is generated.
What can I do to resolve that error?
Regards,
Axel